Continue to Site

Bode plot

Pixelx

Member level 3
Member level 3
Joined
Aug 25, 2024
Messages
56
Helped
0
Reputation
0
Reaction score
3
Trophy points
8
Activity points
512
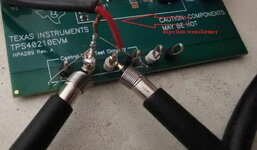
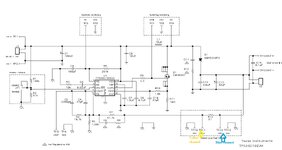
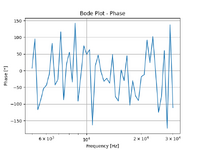
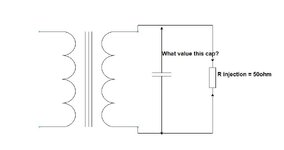
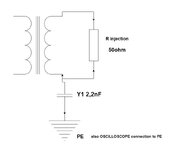
Is it possible to measure the Bode characteristic of the converter using a generator and an oscilloscope? I want to determine the stability reserve of the phase and amplitude. I have a transformer injecting the DHO814 oscilloscope, an FY6900 generator, and I wrote a code in python that injects voltage into the feedback loop on a 51ohm resistor.
I have the impression that my data reading from the oscilloscope is too slow in relation to the regulation. It seems to me that if I read every 100ms, the converter will stabilize by then? Can it be done on the equipment I have?

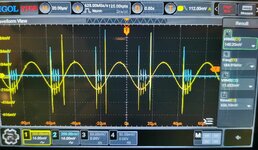
Does the oscilloscope have to be set to the AC range? Because that's what I did

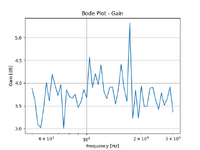
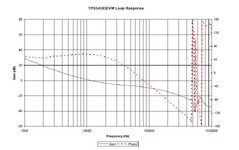
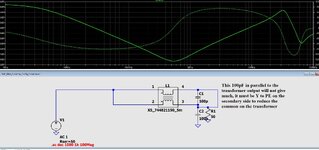
This is how I determine the gain, I don't know if it's right?

amplitude_ratio = (np.max(vout)) / (np.max(vin))
gain_db.append(20 * np.log10(amplitude_ratio))


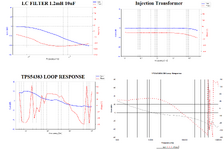
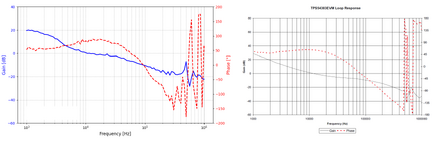
Yellow input waveform and blue output waveform
 

Attachments

  • 1 (1).jpg
    1 (1).jpg
    565.1 KB · Views: 52
  • 1 (2).jpg
    1 (2).jpg
    330.6 KB · Views: 51
  • schematic.JPG
    schematic.JPG
    132.2 KB · Views: 58
  • amplitude.png
    amplitude.png
    33.5 KB · Views: 46
  • phase.png
    phase.png
    42.8 KB · Views: 39
  • TPS.JPG
    TPS.JPG
    65.1 KB · Views: 48
Is it possible to determine such a Bode characteristic in the range from 100Hz to 1MHz in LtSpice of this BUCK converter?
 
To analyze AC transfer function of switching converter, the simulator must support periodic steady state (PSS) analysis or similar methods. Ltspice doesn't. Measurement in transient analysis with frequency stepped sine excitation can be a workaround.

Also there's no useful transfer function above 1/2 of pwm frequency.
 
I have another question from theory. If we have the G(s) converter transmittance, we can simply go to the spectral form G(jw), then generally the transmittance concerns the steady state when it is working or the moment of switching on the converter as well? The moment of switching on, i.e. once the voltage is supplied to the converter input and there is always some unsteady state and does such a transmittance cover it? It seems to me that it does not quite, because we inject the disturbance when the system is already working, i.e. we have a specific G(s) transmittance.


Is it possible to somehow practically determine the formula of the transmittance of such a real converter that we are studying so that its equation is written in the form of G(s)?

If so, are there any tools that support this, or any formulas that could be used to determine it?
 
G(s) of modulator and switching stage is the time-continuous equivalent of actual discontinuous transfer function, e.g. the average response over a switching period.
 
Also i downloaded the attached from LTspice website years ago...it claims to do bode plot from LTspice sim

At 2:15 onwards of this video you hear the designer of LTspice saying that Bode plots arent particularly important for current mode controlled SMPSs...
 

Attachments

  • LTC3854 Bode Analysis.zip
    2 KB · Views: 16
Last edited:
All the more reason to perform square wave step load tests for static %error DC load and AC dynamic sq. wave load %error.
Find the step frequency with a BJT active load to find where error begins to amplify the V step error from low f to high f.
This is where the gain margin is poorest and attenuates error feedback resulting in more error.( if poorly designed current compensation)

Compare static load errors with dynamic square wave loads and make a design budget to include all sources of error.
 
Last edited:
1. I made the characteristics of the 1.2mH 10uF LC filter and confirm it with simulation in LTSpice.

2. Problem with phase measurement. I use the Hilbert transform, but when I reduce the amplitude on the generator, errors appear later. Do you know a better method of determining the phase? And not susceptible to noise?

3. I took the characteristics of the injection transformer using the measuring equipment that I build and also compared it with VNA (measurement from 9kHz to 1MHz). You can see that the transformer works very well up to 1MHz, even up to 2MHz, I think it can be used.

4. I injected the disturbance into the DC/DC converter
I really have a problem with noise. I limited the oscilloscope bandwidth to 20MHz of the X1 probe. I see that the noise is coming through the transformer. It is wound with twisted pair Internet. Maybe some metal can for this transformer to shield it and connect it to PE?

4. The disturbance I injected is 2V pk-pk. I know a lot, but if I give a lower value, the noise is high and the GAIN is lower. With such a value, you can see that I have obtained the GAIN characteristic like the manufacturer, but the problem with measuring the phase is high noise and what is the best method to calculate it?

Please advise me, because the topic is really interesting, I would like to isolate this noise somehow and hide this transformer in something. It's probably a problem with the electric field?
 

Attachments

  • 1.png
    1.png
    266.9 KB · Views: 18
To analyze AC transfer function of switching converter, the simulator must support periodic steady state (PSS) analysis or similar methods. Ltspice doesn't. Measurement in transient analysis with frequency stepped sine excitation can be a workaround.

Also there's no useful transfer function above 1/2 of pwm frequency.
LTspice does have their own way of deriving bode plots automatically from transient simulations, they call it the FRA. It's not as nice as PSS with Cadence Spectre, but is better than manually stepping excitation frequency.
--- Updated ---

I really have a problem with noise. I limited the oscilloscope bandwidth to 20MHz of the X1 probe. I see that the noise is coming through the transformer. It is wound with twisted pair Internet. Maybe some metal can for this transformer to shield it and connect it to PE?
As others have already said, you need a scope with an averaging acquisition mode. AFAIK most basic scopes made in the last ten years should have this.

Also when using averaging mode it is imperative that you have a good trigger source for the scope. Do not try and trigger from waveforms coming from the SMPS itself. If you signal generator has a trigger output, use that. If not, use the signal generator's output routed to another scope channel.

Knowing the model numbers of your scope and signal generator would help us give more specific advice.
 
Last edited:
LTspice does have their own way of deriving bode plots automatically from transient simulations, they call it the FRA.
It's a new feature implemented with recent Ltspice versions. I wasn't aware of it yet, I guess most Ltspice users neither. Thanks.
 
Is it worth hiding the transformer in an aluminum housing connected to PE?

It worked. This is the effect. What do you think about this measurement?
 

Attachments

  • Figure_1.png
    Figure_1.png
    141.6 KB · Views: 4
Last edited:


Write your reply...

LaTeX Commands Quick-Menu:

Similar threads

Part and Inventory Search

Welcome to EDABoard.com

Sponsor

Back
Top