Continue to Site

Welcome to EDAboard.com

Welcome to our site! EDAboard.com is an international Electronics Discussion Forum focused on EDA software, circuits, schematics, books, theory, papers, asic, pld, 8051, DSP, Network, RF, Analog Design, PCB, Service Manuals... and a whole lot more! To participate you need to register. Registration is free. Click here to register now.

testing pulse delay in saturation and active states of a NPN

yefj

Advanced Member level 4
Joined
Sep 12, 2019
Messages
1,420
Helped
1
Reputation
2
Reaction score
5
Trophy points
38
Activity points
8,644
Hello,I want to test the delay of a pulse when NPN is saturated and non saturated state.
I know it depends on the level of the pulse.
From the datasheet and abothe manual i have tried to recreate the state oj the junctions.
At first EB junction must be forward. I have tried to build the circuit below.
As you can see the BE junction is active,also you can see the Vce is very high.
Base current and collector current are attached.
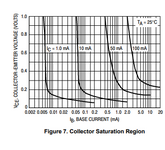
How do i know if my NPN is saturated or active acording to the datasheet attached?
LTspice file is attached.

1718369045246.png

1718370191254.png

1718369162193.png

1718369967784.png


1718366943939.png

1718367297090.png
 

Attachments

  • npn.rar
    495 bytes · Views: 46
Bear in mind that many BJT models do a poor job or no job of fitting saturation region behaviors. Especially so if the device application is not meant to be "switching" and lifetimes are kept high for other interests.

In my 'inside foundry" years I saw really poor modeling on our "linear" processes' storage time (fun, trying to make a 1Mhz MOSFET driver when your reverse recovery times are 10us) and I saw deliberately dishonest model alterations - another guy in the department was having trouble meeting his design specs so he scaled back TR in the common model-pile. And then everybody else thought they were OK until packaged test.

The best indicator of saturation (in model-space) for me is the C-V swing of Cmu in the operating point result. If your simulator can plot those kinds of internal transient operating ponts then that's great.
Hello , could you reccomend me spice model of PNP model which ment for switching?
I know other simulators like HSPICE and cadence virtuoso.
So you say in LTspice its not possible?
" C-V swing of Cmu in the operating point result"
Could you show and example , I could try to recreate and understand?
Thanks.
--- Updated ---

View attachment 191675
Hello Dana, given the plot how you define teh saturation region?because Tony said that the definition of saturation region is not consistant.
What guidlines are there for the saturation region in the plot?
also if you could reccomend me a good LTSPICE model for PNP which is good for switching.
Thanks.
 
Bear in mind that many BJT models do a poor job or no job of fitting saturation region behaviors. Especially so if the device application is not meant to be "switching" and lifetimes are kept high for other interests.

In my 'inside foundry" years I saw really poor modeling on our "linear" processes' storage time (fun, trying to make a 1Mhz MOSFET driver when your reverse recovery times are 10us) and I saw deliberately dishonest model alterations - another guy in the department was having trouble meeting his design specs so he scaled back TR in the common model-pile. And then everybody else thought they were OK until packaged test.

The best indicator of saturation (in model-space) for me is the C-V swing of Cmu in the operating point result. If your simulator can plot those kinds of internal transient operating ponts then that's great.
Cmu is what ? Is that Miller C ?

Do you have an example for this plot ?


Regards, Dana.
 
Hello Dana, given the plots you made could you be specific where in them i can see the saturation region because i am confused.
I want one agreabale method by all to know that in "such and such" region of the plot its saturation and the other is active(linear).
Thanks.
 
Cmu is what ? Is that Miller C ?

Do you have an example for this plot ?


Regards, Dana.
Cpi and Cmu are simple BJT models' junction
capacitances @ the OP. Whereas Cje and Cjc are
model input params (as well as common speech).
Cmu = Cjc when Vcb=0 and no DC current, but
Cmu moves around w/ bias. Forward bias current
injection collapses the depletion region and elevates C.
 
Hello, i have tried to recreate the sweep plot for the 2N2369 NPN as Tony described.
Did you? Why not write the simulation exactly visualizing the problem? Ic = f(Vce) with parameter Ib.

1718808521178.png

--- Updated ---

Similarly, you can plot the saturation curve according to post #6, Vce = f(Ib), parameter Ic

1718809830370.png
 
Last edited:
Did you? Why not write the simulation exactly visualizing the problem? Ic = f(Vce) with parameter Ib.

View attachment 191720
--- Updated ---

Similarly, you can plot the saturation curve according to post #6, Vce = f(Ib), parameter Ic

View attachment 191721
Hello FVM, given these plots what is the consenzus by definition in each plot the saturation region?
for example given IC(Q1) plot vs Vce
What voltage range of V1 you consider as saturation?
Thanks.
 
I think you (yefj) are off in the weeds relative to your
original post. If you are after turnoff delay then set it
up on the bench with a real transistor, real load, real
base drive (Zsink matters a lot) and real temperature
forcing, vary the load to vary Ic(sat) and vary base drive
(source level) to get you the right output swing, and you
can have all the data you need in an afternoon.

Now pay attention to that VOL level as it is a huge
influence on the stored charge,being as Vf of C-B
diode is Vbe-Vce and IF is exp(Vbc). Get your right
answer by trimpot or supply of the predriver / sig-gen.

There is a relation of "forced beta" to Vce(sat) and
if you oversupply the base current you will go further
into saturation and take longer to come back out.
The interest in VOL

Test it like you mean to use it. Less worrying about
second-, third-hand proxies and textbook stuff.
 
Hello Dana, Yes i understand the idea. the plot below is Vce(Ib).
Vce values are constant. at saturations at the place i marked with red line.

Could you reccomend me a PNP bjt where i could see a big difference between the switching from active a switching from saturation states?
1718910134753.png
 
Update:
Hello, I have made the PNP simulation below of simple PNP transistor.out current is the "holes" we push the holes from the emiter to the base at first step.
So Ve>Vb. In active region we want the base collector junction to be reverse Vc<Vb.
So the situation below is active region.
for the situation to be in saturation the Vc-Vb>0.4.

I dont like using current source in simulations because in real life I only voltage sources.
So in order to create a plot as figure 8 ,I need to Sweep Vce and measure IC
In the last photo i tried to sweep Vce and measure Ic while stepping Vgate.
I got a ttotaly different plot shape.
Where did i go wrong?
1719063764688.png


1719060051881.png
1719059374656.png


1719064250643.png
 

Attachments

  • 2N5087 (1).PDF
    155.9 KB · Views: 35
  • 1719063397950.png
    1719063397950.png
    28.2 KB · Views: 42
After many attempts, this is how to do it. I added the power curves for giggles.

The invisible threshold between "linear" and "non-linear" due to saturation depends on your criteria for these thresholds. One can see it graphically in terms of incremental change in slopes, and translate that into THD or % change in hFE or some other measurement.

1719107915270.png


1719108853363.png

To focus on Vce sat boundary, limit Vce to 2 V and current to max using larger step size.
 

Attachments

  • curve-trace 2n2222.zip
    433 bytes · Views: 34
Last edited:
Update:
Hello, I have made the PNP simulation below of simple PNP transistor.
In principle your PNP gets shut off via low-ohm bias resistor connected to a supply rail. To turn it on the bias is pulled low by a lower voltage. Electrically this is not an error.

However bias of PNP is referenced to the supply rail (the more positive terminal, usually the emitter). Therefore you'll obtain similar graphs as those of NPN, if you apply bias to the PNP referenced to the supply.
 

LaTeX Commands Quick-Menu:

Similar threads

Part and Inventory Search

Welcome to EDABoard.com

Sponsor

Back
Top