Continue to Site

Welcome to EDAboard.com

Welcome to our site! EDAboard.com is an international Electronics Discussion Forum focused on EDA software, circuits, schematics, books, theory, papers, asic, pld, 8051, DSP, Network, RF, Analog Design, PCB, Service Manuals... and a whole lot more! To participate you need to register. Registration is free. Click here to register now.

Building the impedance measurement circuit

Kamran786

Newbie level 6
Newbie level 6
Joined
Jul 11, 2024
Messages
12
Helped
0
Reputation
0
Reaction score
0
Trophy points
1
Activity points
207
Dear Members,

I hope you are all doing well.

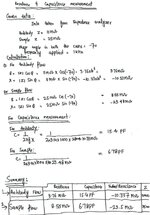
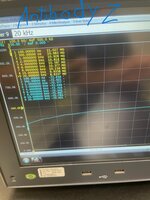
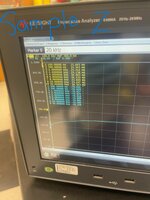
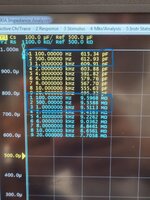
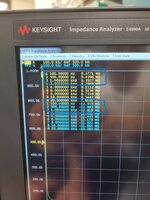
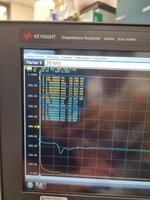
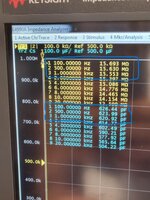
I am a PhD student and completely new to circuit design. I need a compact-sized circuit and prefer not to use an impedance analyzer due to its bulkiness. I am looking to build a circuit capable of automatically measuring the impedance of a sensor in the range of 1MΩ to 30MΩ. However, I am unsure how to approach this task, especially with the various methods available for impedance measurement. I’m not certain which method would be most suitable for automatic measurement in my case. There are different impedance measurement modules, but none seem to have the capability to measure impedance automatically within this range. My sensor’s equivalent circuit is a resistor in parallel with a capacitor.

Could someone guide me through the procedure to build the circuit design? Specifically, I would like to know which components I should purchase to begin building the circuit. If there are any tutorials or resources that you could recommend, that would be very helpful as well.

So far, I have only completed the integration of a DDS (Direct Digital Synthesis) with an Arduino to generate a signal with a frequency of 1 kHz and an amplitude of 500mV, which meets my signal requirements. However, I am uncertain about how to proceed with the remaining circuit design.

Your help in this matter would be greatly appreciated.
 
Hi,

post#5 is still unanswered.
And I don´t have a clear view what information your application is after.
--> Sketches, clear and complete informations, examples ... could be very helpful. (in the end - for you)

This makes me impossible to give assistance.

Klaus
 
1723633533733.png


Just to be clear [posts # 6 or #11) are single chip solutions, that is the the 20 bit ADC, the DDS, OpAmps, all the stuff
shown is in the PSOC chip. PSOC Creator is an IDE used to drag and drop these components, and others, onto chip design canvas,
user right clicks each, sets its parameters, then uses routing wizard to connect internally with other components,
or external, then writes code. Each component has a lib of f() calls to manipulate it under code, like change DDS freq,
read the ADC, traditional code stuff. It is not a simulator. It is used, however, to debug project as well as code the project.

So this is board you would use to do design, it has all the hardware basically you need. 2 PSOCs on it, one the target
chip under development, the other to control the target in debug and programming. Once done you snap off debug/
programmer and either use the remaining board for project or just use its chip for your own PCB.

1723634423744.png


Lastly here is whats in the PSOC, multiple copies in many instances :

1723634651212.png


Hope that clears up confusion.


Regards, Dana.
 
You did not mention testing with a variable voltage current source to read impedance directly.
Then impedance can be converted to vectors. How nonlinear is the response to voltage?
Dear Sir.
Thanks a lot for the reply.
I have few confusion regarding this that's why scare to apply the multiple frequencies.
1) there could be joule heating effect happen inside the channel.
2) there is break down of electrode could happen because of over voltage apply.
That's why i am using the constant 500vM RMS voltage. we actually apply the the RMS voltage using impedance analyzer, so for this reason i scare to change the voltage, but i will look for this option as well.
--- Updated ---

Hi,


please share your calculation. An impedance with a magnitute of 11 Meg (or 25 Meg) and a phase of -70° will for sure not result in a in a reistance (real part {Re}) of 11 Meg.

BTW, the measurment results are nor really useful, as it seems you used the complete frequency span instead of the range of interest. A result up to ~100 kHz would be more helpful to interpret.

BR
Dear Sir.
I am going to attach the calculation page, in case of some problem in my calculation, please tell me.
If this is the case if will check the results at each frequency less than 1kHz and greater 100Hz
--- Updated ---

Hi,

post#5 is still unanswered.
And I don´t have a clear view what information your application is after.
--> Sketches, clear and complete informations, examples ... could be very helpful. (in the end - for you)

This makes me impossible to give assistance.

Klaus
Dear Klaus.
I am going to provide the complete information.

I have a sensor made from a microfluidic device with a channel inside it. At the bottom of the channel, there are electrodes to which I will send the signal.
Initially, when I flow the antibody through the channel, the antibody attaches to the electrodes surface on the bottom of the channel, resulting in an impedance value of 8-11 MΩ. After some time, I flow the sample into the channel. The sample again attaches to the electrode surface, causing the impedance value to rise to 25-28 MΩ.
I need to provide a signal with an amplitude of 500 mV. However, frequency-wise, I will use two different values. This is not the sweeping of frequency, but taking measurement at two different frequencies
  1. 100 Hz
  2. 1 kHz
I will take measurements at these two frequency points at different time intervals. I will not sweep the frequency from 100 Hz to 1 kHz, and I need to measure the phase angle or other parameters as well while in the impedance measurement.
I hope this clarifies the situation. If you have any further questions, please feel free to ask. Your comments are very valuable to me.
I am going to attach the pictures of impedance analyzer during taking the reading at antibody and sample flow and on the bases of these reading of impedance analyzer, i did the calculation for capacitance and resistance of the sensor, if this calculation is wrong kindly let me know.
I used the -70 angle for reference, the angle remains between -68 to -72
--- Updated ---

View attachment 193054

Just to be clear [posts # 6 or #11) are single chip solutions, that is the the 20 bit ADC, the DDS, OpAmps, all the stuff
shown is in the PSOC chip. PSOC Creator is an IDE used to drag and drop these components, and others, onto chip design canvas,
user right clicks each, sets its parameters, then uses routing wizard to connect internally with other components,
or external, then writes code. Each component has a lib of f() calls to manipulate it under code, like change DDS freq,
read the ADC, traditional code stuff. It is not a simulator. It is used, however, to debug project as well as code the project.

So this is board you would use to do design, it has all the hardware basically you need. 2 PSOCs on it, one the target
chip under development, the other to control the target in debug and programming. Once done you snap off debug/
programmer and either use the remaining board for project or just use its chip for your own PCB.

View attachment 193055

Lastly here is whats in the PSOC, multiple copies in many instances :

View attachment 193056

Hope that clears up confusion.


Regards, Dana.
Dear Sir.
Thanks a lot for the reply.
Yes i have cleared all the confusion.
Thanks again
--- Updated ---

Your antibody measurement data looks suspect
View attachment 193057
Dear Sir,
I have attached the impedance analyzer results as well in the comments during the time of antibody flow and sample flow, You can verify the results of impedance and their phase as well over there in the comments sections.
I will take the measurement at two different frequency values, 100Hz and 1Khz.
it would not be sweeping of frequency
 

Attachments

  • 8aadc0fd-cdd6-4304-ad63-ba31b5ff28a7.jpg
    8aadc0fd-cdd6-4304-ad63-ba31b5ff28a7.jpg
    150.8 KB · Views: 41
  • 8aadc0fd-cdd6-4304-ad63-ba31b5ff28a7.jpg
    8aadc0fd-cdd6-4304-ad63-ba31b5ff28a7.jpg
    150.8 KB · Views: 41
  • impedance data 2.jpg
    impedance data 2.jpg
    199.4 KB · Views: 35
  • impedance data.jpg
    impedance data.jpg
    183.1 KB · Views: 37
Last edited:
Regardless of your unknown reference angle and computations, the raw plots still look suspect since they do not follow any linear or non-linear known characteristics of Z(f), X(f) or R(f). The R^2 result of any plotted curvefit is too low and no explanation of behavior or test methods. I suggest to your Prof to repeat them using both of my suggested methods. Hi Z CC and low Z CC simulations are given in my previous comment . You can scale the input to be less than 500 mV and max Z(f).

You show no calibration results with known lumped elements to normalize/verify your test fixture.
e.g. (Short, open, Thru: 10 Meg R || 10 pF NPO cap.)
Why is that?


Falstad's site may be down at the moment.
 
Last edited:
Dear Sir.
Your concerns are really genuine.
From onward, we will also explore additional options for the impedance analyzer, such as measuring resistance, capacitance, and reactance of the sensors, if these options are available in addition to impedance and phase angle.

Our process involves flowing the sample and antibody through the device, allowing them to dry, and then taking measurements with the impedance analyzer. The amplitude of the signal is fixed, and we vary the frequency from 100 Hz to 1 MHz using the impedacne analyzer. When we reach a frequency of 1 MHz for my sensor, the impedance drops to less than 4-5 MΩ, and the angle changes to -52 degrees.

Best regards,
 
Hi,

at first you talk about 1kHz only
then two frequencies 100Hz and 1kHz
In the photos we see a lot of frequencies between 100Hz and 20kHz
Now you say we vary the frequency from 100Hz to 1MHz

This is anything else than consitant information
I don´t know what to focus on.

What is true, what is not?

I better leave this thread ... than to annoy by repeatedly asking for clear informations.

Klaus
 
Last edited:
Hi,

at first you talk about 1kHz only
then two frequencies 100Hz and 1kHz
In the photos we see a lot of frequencies between 100Hz and 20kHz
Now you say we vary the frequency from 100Hz to 1MHz

This is anything else than consitant information
I don´t know what to focus on.

What is true, what is not?

I better leave this thread ... than to annoy by repeatedly asking for clear informations.

Klaus
Sorry for the confusion

There may have been some misunderstanding in explaining the question.

I mentioned that we used frequencies from 100 Hz to 1 MHz with the impedance analyzer, but I don't want to use the impedance analyzer. Instead, I want to build a circuit that can measure impedance using only two frequencies:

  • 100 Hz
  • 1 kHz
We used the broader frequency range only with the impedance analyzer. However, when I build the circuit, I will only use the 100 Hz and 1 kHz frequencies.

The reason for attaching the picture of the broader frequency range was just to show the sensor's response across a wider range of frequencies.

I hope this clears up any confusion. Apologies for the misunderstanding.
--- Updated ---

Today i have again taken the reading of my sensor using the impedance analyzer.
I have attached the picture that shows the information of my sensors'
1) capacitance.
2) Impedance.
3) phase angle.
4) Reactance

In case of any question, kindly tell me
 

Attachments

  • 0111.jpg
    0111.jpg
    353.4 KB · Views: 27
  • 0222.jpg
    0222.jpg
    296.7 KB · Views: 27
  • 03333.jpg
    03333.jpg
    279.1 KB · Views: 23
  • 04444.jpg
    04444.jpg
    346.9 KB · Views: 24
Last edited:
Your bridge references to the unexpected values, which seem to not make sense. 500 uF for 500 pF nominal results and 500 kOhms for 10Meg nominal results.

1723790160461.png

Note that in the Wheatstone bridge and any other bridge with a voltage source, one must use balanced references equal to the device under test to null for good accuracy. (otherwise, the impedance is a complex product and sum)

Only in the case of current sources will the impedance be proportional and linear to voltage.

I suggest that you justify your setup as I do not understand your readout or do as I suggested for impedance measurements with AC constant current (CC) to measure voltage as done in RLC meters at different frequencies.

The Howland CC is one method for AC rms or DC current.

It is also unclear how your sensor functions and there must be some generative response to stimulus that is unclear and nonlinear.

Show a polar plot or a log sweep to 1MHz for example with a fixed RC in this range for calibration.
 
Last edited:

LaTeX Commands Quick-Menu:

Part and Inventory Search

Welcome to EDABoard.com

Sponsor

Back
Top