Continue to Site

Welcome to EDAboard.com

Welcome to our site! EDAboard.com is an international Electronics Discussion Forum focused on EDA software, circuits, schematics, books, theory, papers, asic, pld, 8051, DSP, Network, RF, Analog Design, PCB, Service Manuals... and a whole lot more! To participate you need to register. Registration is free. Click here to register now.

learning to use MultiSim

Status
Not open for further replies.
Yes it is center-tapped transformer
 
  • Like
Reactions: PG1995

    PG1995

    Points: 2
    Helpful Answer Positive Rating
Hi

Please have a look on this video:
YouTube - ‪changesize.avi‬‏

How do I change the size of a particular component without affecting the size of other components and drawing? Please let me know. Thanks.
 

I don't think there is a way to do what you want unless you edit the actual symbol of the component (right click-> edit symbol) but I wouldn't advise you to do it, what you are currently using is the zoom function that zooms the complete schematic and should be enough when you want to focus in a a specific area.

Alex
 

Anyway, thanks for the information, Alex.

I was able to draw the circuit for full wave rectification using center tapped transformer. Thanks to you all fine people. The drawing is in MS10.

1: Do you have any suggestions to improve the drawing?

2: It seems that you must have a ground to run the simulation, otherwise it won't run.

3: As you can see in the following video that when I try to place a connector I get an 'extra' red label "IO1". Why is so? How do I get rid of this? Besides, is there a permanent way to decrease the size of labels which I get along with the components - e.g. for the resistor I get "R1 1kΩ"?

Video: YouTube - ‪hbscconnector.avi‬‏
 

Attachments

  • fullwaverectification.rar
    60.7 KB · Views: 101
  • fullwaverectification.jpg
    fullwaverectification.jpg
    105 KB · Views: 134
  • simulation error.jpg
    simulation error.jpg
    185.4 KB · Views: 156

The font size can be changed from options -> sheet properties -> font

IO1 and IO2 are just the net names because you have set them to be visible, are the specific net names a problem?
If you want to change the net name then double click on the net line and enter a new name

A gnd should exist in spice circuit as a reference, this shouldn't be a problem in your circuit

Why have you used leds instead of diodes?
Also change your mains supply frequency to 60Hz

Alex
 

IO1 and IO2 are just the net names because you have set them to be visible, are the specific net names a problem?
If you want to change the net name then double click on the net line and enter a new name

But why do I get two net names instead of only one? One is in black and the other red one appears when I move the connector?

By the way, what are these "net" names?

A gnd should exist in spice circuit as a reference, this shouldn't be a problem in your circuit

Do you mean that not having a grnd symbol won't affect anything in my circuit? I tried to run simulation without using a grnd symbol, it didn't work.

Why have you used leds instead of diodes?

Because LEDs make it more easy for me see that the circuit is working. Isn't having a LED in a circuit good idea?

Also change your mains supply frequency to 60Hz

Is there a particular reason to have 60Hz frequency? Less frequency makes the blinking of the LEDs more visible?

Thank you for all the help.
 

I saw two net names when the gnd was not connected, when it is connected the gnd node is named 0.
Every node of the circuit gets a name , a net is a wire that has the same voltage, when it connect to another component then a new net starts at the other side of the component.

about the gnd, I meant that putting the gnd in your circuit would be a problem, you should use a gnd in the output

A led is fine but it can't be used as a rectifier, inreality at least , it will burn.
Also you leds will have a high forward voltage drop of about 2.2v instead of the 0.7 of a diode

You can use any frequency fut to see an output ripple that is close to the real behavior of the circuit you need 60Hz.

Alex
 

Thanks a lot, Alex.

1:
about the gnd, I meant that putting the gnd in your circuit would be a problem, you should use a gnd in the output
But I have successfully used more than one grnd in the circuit. I'm trying to what you were suggesting to me?

2:
I think Jony has told me about that but I don't seem to remember. The o-scope isn't working. Please have a look here: YouTube - ‪sizeandoscope.avi‬‏

3:
How do I increase or decrease the size of circuit diagram workspace?

4:
I have always taken a node to be the place where two or more than branches meet. A branch has a component or components in series connection. The "net" is a new term for me. Is it specific to MultiSim?
 

Attachments

  • fullwaverectcrkt.jpg
    fullwaverectcrkt.jpg
    115.2 KB · Views: 216
  • fullwaverectification.rar
    67.1 KB · Views: 100

1) you can use two gnd if you want but the primary of the transformer can work without the gnd if you want.

2) I can't see in the video what is wrong, did you check the V/div scale?

3) options -> sheet properties -> workspace

4) A node is the connection point that is correct, I think I have seen the net in other simulators too but in any case it represents all the wires connected to each node (and have the same voltage of course)

Alex

---------- Post added at 20:56 ---------- Previous post was at 20:51 ----------

There is something wrong with the connection between IO1/IO4 and IO2/IO5 , if you connect the oscilloscope directly to the nets it will work fine

Alex
 

Here you have working simulation
 

Attachments

  • fullwaverectification2.rar
    901.7 KB · Views: 87

Thanks a lot, Jony, Alex.

@ Jony: Your attached circuit does work.

I have very little experience with real o-scope. So, I think it's better to ask some questions about it.

1:
Does o-scope show Vrms or Vo?
Vrms = Vo/sqrt(2)
=> Vo = Vrms x sqrt(s) = 120 x sqrt(s) = 170 V

2:
It looks MultiSim virtual models of o-scopes from two difference manufacturers: Tektronix, Agilent. Which one is better?

3:
Rectified wave should have peak voltage 120V (assuming o-scope shows Vrms). But as you can see for CH1 the set scale is 50V/D which means one must get two full boxes (or, squares) and a little bit of third box. But this is not the case. It doesn't even take one full square. But CH3 displays correct waveform because it occupies two squares and little bit of third square.

4:
Sometimes I get Trig'd and Ready, and other times Auto and Ready. What is that?

5:
I see CH3 and CH4 are being used to display voltage across the primary. But I'm getting two waveforms: one for CH3 and other for CH4. How do I get one waveform? How does it work?

6:
I think "POSITION" knob above the, let's say, "CH1 MENU" button sets the position of x-axis. Am I correct?

7:
As you can see in the videos that the waveforms are being drawn very slowly, what's the reason for this?

I know I have asked a lot of questions and it would a lot of energy and time to help me. It would very kind of you. Attached diagrams and the linked videos would help you understand what I'm saying in those questions.

Videos:
YouTube - ‪learningoscope.avi‬‏
YouTube - ‪3inputs.avi‬‏
 

Attachments

  • tektronixoscope.jpg
    tektronixoscope.jpg
    73.6 KB · Views: 134
  • oscopesinputs.jpg
    oscopesinputs.jpg
    74.7 KB · Views: 130
Last edited:

1) an oscilloscope shows the peak-peak voltage on the screen, there is a measure function to show RMS if you want but as a measured number , the trace will always show a peak to peak signal

2) actually there are three , there is one more, the virtual one that multisim has and the other two are functional identical of the real model, I guess everyone has its own preference, I like Tektronix.
In some cases the virtual oscilloscope will be useful because anything shown in the oscilloscope is also drawn in a graph and there you can zoom it to exam a specific section easier, it also has a +- for each channel so you can use different reference for the two channels (for example it can show the 120v voltage without the need to add the gnd).
Try to connect it , simulate for a while and then click view -> grapher to see the oscilloscope trace in a big graph

3) the oscilloscope shows the signals referenced to the gnd, if you haven't got a gnd connected to the 120v then you can only get the correct measurement using a differential measurement like a voltmeter.
Add the gnd and you will see the 120v fine.

4)when you use a trigger level and the signals hits it then you get the triggered, don't worry about that as long as you gan get a steady trace you are fine

5)There is only a math function between CH! & CH2 , CH3 and CH4 are single channels only

6) the position knobs move the trace up/down so that you can center it , its an offset , onwe for each channel

Alex

P.S. the multisim virtual oscilloscopes have two versions, the two channel version has +- for each channel, the four channel version has a common - like the Tektronix
 

Many, many thanks, Alex.

3) the oscilloscope shows the signals referenced to the gnd, if you haven't got a gnd connected to the 120v then you can only get the correct measurement using a differential measurement like a voltmeter.
Add the gnd and you will see the 120v fine.

But the circuit is already grounded and CH1 is grounded too.

4)when you use a trigger level and the signals hits it then you get the triggered, don't worry about that as long as you gan get a steady trace you are fine

Could you please give me a little detail about trigger level? I have also seen on real o-scope.

5)There is only a math function between CH! & CH2 , CH3 and CH4 are single channels only

Yes, I see "MATH MENU" only between CH1 and CH2. But aren't CH3 and CH4 being used to measure voltage across the primary? If not, then why two wires from the primary connect to CH3 and CH4? I don't even get waveform which represents voltage across the primary.

As you can see in the videos that the waveforms are being drawn very slowly, what's the reason for this?

I'm very much thankful for all the help.
 

Attachments

  • fullwaverectification2b.rar
    901.7 KB · Views: 80

First run the simulation, then go to MATH MENU
And then press 1 ---> press 2
Next set position and Voltage/div =100V and next you can off channel 3 and 4.


But you can use transient analysis to "see" the voltage in certain nodes.
1


2


3


and we end up with this waveforms
 
  • Like
Reactions: PG1995

    PG1995

    Points: 2
    Helpful Answer Positive Rating
But the circuit is already grounded and CH1 is grounded too.

The circuit has two sides isolated by the transformer, if you don't add the gnd to the primary of the transformer then the 120v will be floating, you can't measure it correctly with reference to gnd.

Could you please give me a little detail about trigger level? I have also seen on real o-scope.
maybe something like this will help
Oscilloscope Trigger Controls - Trigger Level and Slope - Trigger Sources - Trigger Modes - Trigger Coupling - Trigger Holdoff
https://www.edaboard.com/threads/25272/

But aren't CH3 and CH4 being used to measure voltage across the primary? If not, then why two wires from the primary connect to CH3 and CH4?

channel 3 and 4 are two independent inputs that measure referenced to gnd, connecting the two ends of the 120v supply to two different channels doesn't mean that you will get a differential measurement

As you can see in the videos that the waveforms are being drawn very slowly, what's the reason for this?
The simulation speed can be effected by the PC speed, the circuit complexity, the simulation accuracy etc.
Some circuits simulate slower than other, I can't give you a detailed explanation

Alex
 
  • Like
Reactions: PG1995

    PG1995

    Points: 2
    Helpful Answer Positive Rating
Thank you very much for all the help, Jony, Alex. I realize it takes a lot of time to help with such stuff. And please do excuse my constant queries on the same subject.

@Jony: I think the peak voltage for CH1 should be 120V, or should it be 170V ( Vrms x sqrt(2) )?

Anyway, I don't get the same output as you do. Although the o-scope menus on the screen look the same as in your attached screenshot:
https://img593.imageshack.us/img593/9308/jony1.jpg

I'm getting three waveforms, and other problem, as you can see, is that CH1 doesn't even occupy 1 division on the display!

In the following video you would notice two things: 1) the trace (or whatever you call it!) starts at the middle of the screen, why is so?, 2) CH3 and CH4 measure voltage across the primary and their waveforms are out of phase but their peak voltage should be the same, right? The set scale is different for both of them but in spite of this the waveforms for CH3 and CH4 occupy the same numbers of squares (or, divisions) on the screen. Why is so?

Video: ‪oscopefuss.avi‬‏ - YouTube

I think transient analysis can used to measure voltages across the circuit. In the following video what are those V(1), V(2), etc.? I think they are the voltages across the nodes 1, 2, etc. And what is that I(v1)?

Video: ‪transientanalysis‬‏ - YouTube

Many thanks for your help and especially you time.
 

I think the peak voltage for CH1 should be 120V, or should it be 170V ( Vrms x sqrt(2) )?
The input voltage is 120V RMS do the peak will be equal to 120V*√2 = 169.7V

Anyway, I don't get the same output as you do. Although the o-scope menus on the screen look the same as in your attached screenshot:
https://img593.imageshack.us/img593/9308/jony1.jpg

I'm getting three waveforms, and other problem, as you can see, is that CH1 doesn't even occupy 1 division on the display!
For CH1 change Voltage/div, switch off CH3 and use "position" knob to move the waveform down.

Video: ‪oscopefuss.avi‬‏ - YouTube
1) the trace (or whatever you call it!) starts at the middle of the screen, why is so?, 2)
Becaues trigger is set to starts at the middle of the screen. The first position knob from the right.
CH3 and CH4 measure voltage across the primary and their waveforms are out of phase but their peak voltage should be the same, right? The set scale is different for both of them but in spite of this the waveforms for CH3 and CH4 occupy the same numbers of squares (or, divisions) on the screen. Why is so?
The voltage measure by CH3 is the voltage between node 3 and GND and for CH4 we have very similar situation (Node 4 and GND).
The primary voltage is equal to voltage at node 3 minus voltage at node 4.

I think transient analysis can used to measure voltages across the circuit. In the following video what are those V(1), V(2), etc.? I think they are the voltages across the nodes 1, 2, etc. And what is that I(v1)?
I(V1) = current that is flow form the AC voltage source (V1)
 

As I said the oscilloscope shows the voltages referenced to gnd, if you don't add a gnd in the primary of the transformer you will get that strange results because the primary is floating.
The voltage source is 120v RMS so Vpeak=120*√2=169.70v and Vp-p=339.4v , the oscilloscope will show that Vp-p.

In your oscilloscope picture you have the red trace on which is the math between CH1 and CH2 but you haven't connected anything to CH2 so what is the point of that trace?

Alex
 

Thanks a lot, Jony, Alex.

For CH1 change Voltage/div, switch off CH3 and use "position" knob to move the waveform down.

I have changed the Volts/Div setting. The setting is 20 Volts/Div. The peak voltage for CH1 should be 170V because the rectified wave have the same peak voltage as the primary. Right? The waveform hardly occupies two divisions; 2 divisions multiplied by 20 Volts/Div is equal to 40V. So, what's wrong? Please help me

https://img231.imageshack.us/img231/6227/ch1sf.jpg
 

Thanks a lot, Jony, Alex.
I have changed the Volts/Div setting. The setting is 20 Volts/Div. The peak voltage for CH1 should be 170V because the rectified wave have the same peak voltage as the primary. Right? The waveform hardly occupies two divisions; 2 divisions multiplied by 20 Volts/Div is equal to 40V. So, what's wrong? Please help me

https://img231.imageshack.us/img231/6227/ch1sf.jpg
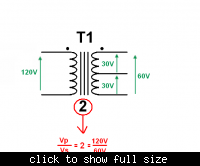
Everything is okey. You use step-down transformers.
The relationship between primary (input) voltage (Vp) to a secondary voltage (Vs). is given by Vp/Vs = n, where n is the ratio of the primary turns to the secondary turns. The parameter n can be adjusted.

So your output voltage is equal
30V * 1.41 = 42.3 minus the voltage drop across the LED
 

Status
Not open for further replies.

Part and Inventory Search

Welcome to EDABoard.com

Sponsor

Back
Top