Mahendra_3
Newbie

Hi everyone,
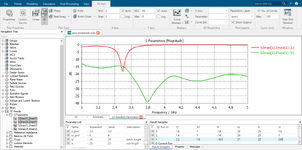
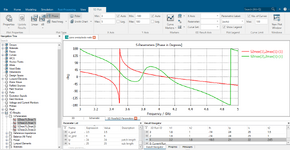
I’m working on an Intelligent Reflecting Surface (IRS/RIS/metasurface) in CST Studio, and I'm seeing a sudden change in S-parameters at my resonance frequency (3.5 GHz). This doesn’t match the smooth transition from 180 to -180 degrees reported in many IEEE papers. mean while some paper has the same graph as mine.
Additionally, are there any processes to bias the IRS in CST? I’ve attached a graph showing the S-parameters for reference.