Continue to Site

Welcome to EDAboard.com

Welcome to our site! EDAboard.com is an international Electronics Discussion Forum focused on EDA software, circuits, schematics, books, theory, papers, asic, pld, 8051, DSP, Network, RF, Analog Design, PCB, Service Manuals... and a whole lot more! To participate you need to register. Registration is free. Click here to register now.

Temperature sensor readout

Status
Not open for further replies.

engr_joni_ee

Advanced Member level 3
Joined
Nov 3, 2018
Messages
822
Helped
2
Reputation
4
Reaction score
7
Trophy points
18
Activity points
6,875
Hi, I have a temperature sensor readout system for pt1000. We need to calibrate sensors. If we take two reading at 0C and 100C and draw straight line between adc readings on x-axis and temperature in C on y-axis. We don't need to be very precise but we need to read temperature at -100C and -150C. I guess if we use the straight line calibration between 0C and 100C then how much pt1000 deviate at -100C and -150C ?

My findings when I look at the resistance values in datasheet of pt1000 is that at -100C there is a offset of 3C and at -150C the offset is 6C.
 
Last edited:

Pt1000 sensors are rarely user calibrated, you'll simply assume that they follow the specified characteristic with deviations according to the respective tolerance class. You'll however adjust respectively calibrate the temperature transducer. Using a linear characteristic is rather inaccurate, even for limited range of 100K. Pt100/Pt1000 characteristic is defined in IEC standandard by a polynomial or a table. I suggest to use at least a quadratic correction term for limited range.

There's a good application note from Analog Devices discussing different correction methods for Pt measurements. It comes to the conclusion that a look-up table achieves highest accuracy with least coding effort.


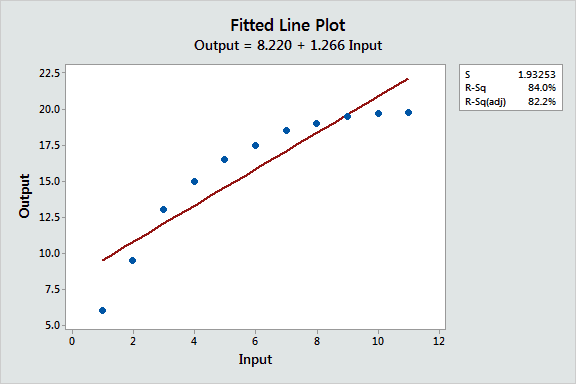
Least squares quite useful for non linear compensation. And, unlike a table, it is a continuous f().


Or power curve fitting with other methods -


Regards, Dana.
 

And, unlike a table, it is a continuous f().
For those not familiar with the usage of look-up tables in function representation: It's actually look-up table with piecewise linear interpolation. The application note explains in detail.
 

For those not familiar with the usage of look-up tables in function representation: It's actually look-up table with piecewise linear interpolation. The application note explains in detail.

Not a mathematician here but I thought key problem with Least Squares was abrupt non continuous change in slope at the data points. So the f() derived is not continuous, its error higher than many other methods of interpolation.

But commonly used because of computation efficiency, ease of use.

The more accurate methods use general polynomial, LaGrange, Taylor, Spline, Minmax......

Mathematicians help needed here .....:)


Regards, Dana.
 

Status
Not open for further replies.

Similar threads

Part and Inventory Search

Welcome to EDABoard.com

Sponsor

Back
Top