Continue to Site

System Transfer Function - Reverse Engineering

Pixelx

Member level 3
Member level 3
Joined
Aug 25, 2024
Messages
63
Helped
0
Reputation
0
Reaction score
3
Trophy points
8
Activity points
558
Hello,

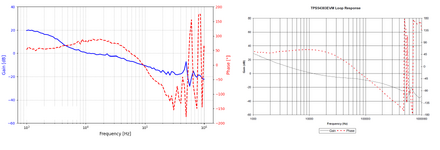
Is it possible to derive the transfer function G(s) of the tested system based on the studied Bode and Nyquist characteristics of the converter? I mean a mathematical formula that could be used for further analysis. Are there any tools for this or do you have any scripts in which the characteristics (GAIN, phases, freq) can be loaded?


Example of characteristics from the network
 

Attachments

  • Loop-Gain-Plot-of-Gain-and-Phase-Margin-768x513.jpg
    Loop-Gain-Plot-of-Gain-and-Phase-Margin-768x513.jpg
    68.8 KB · Views: 27
Have you learned yet how to define the poles and zeros from the plot?

If you examine phase slope changes count the +/- slope changes and determine how many poles and zeros you have and estimate the asymptote f from the amplitude plot. The phase changes slope -45 deg/ dec before and +45 deg/dec after a pole. The "zero" is visa versa, and the amplitude asymptote is in the middle of those phase shift pairs.

for example if it were 3 zeros and 4 poles, choose the number and values of poles and zeros in this format.

1743193932365.png

e.g. a single pole
1743194913749.png
 
Last edited:
Just type in the attached pole and zero expressions to excel, and put in the frequencies where you think they are, and plot out...then you will get the equivalent plot.
You know every topology has poles and zeros at specific frequencies so go from there....for example a Buck in current mode ccm has a zero at the "esr zero" frequency etc etc.
So shovel in the poles and zeros, insert the frequencies, and thats your expression.

I read book "power supply design volume 1 control" by Dr Ridley.

On page 70 for currnt mode buck in currnt mode ccm......
..A single pole at low freq determined by output C and load resistor
..An ESR zero
..A pair of double poles at half the switching freq is controlled with ramp addition.

...so there you go, easy to plot out the power stage transfer function. Just emperically sub in frequencies till the plot is like what you measured with your gain phase anayser in the lab.

The attached pages show you hopw to make up the transfer function from the poles and zeros.
 

Attachments

  • Pole n zero expressions.zip
    2 MB · Views: 13
Thanks for the materials, I will analyze them. For now, I have carried out a study of the Bode characteristic for the converter.

And how would you describe the characteristic I have here? Could you show me how you would approach it? Because it is a bit more difficult than some RC filter.

I will learn from what I managed to read from the BOOST converter myself
 

Attachments

  • Figure_1.png
    Figure_1.png
    141.6 KB · Views: 12


Write your reply...

LaTeX Commands Quick-Menu:

Similar threads

Part and Inventory Search

Welcome to EDABoard.com

Sponsor

Back
Top