Continue to Site

Welcome to EDAboard.com

Welcome to our site! EDAboard.com is an international Electronics Discussion Forum focused on EDA software, circuits, schematics, books, theory, papers, asic, pld, 8051, DSP, Network, RF, Analog Design, PCB, Service Manuals... and a whole lot more! To participate you need to register. Registration is free. Click here to register now.

Switched capacitor circuit design using cadence

Status
Not open for further replies.

viperpaki007

Full Member level 5
Full Member level 5
Joined
Jul 2, 2008
Messages
274
Helped
11
Reputation
22
Reaction score
8
Trophy points
1,298
Location
Finland
Activity points
3,437
Hi,

I am planning to use cadence spectre RF tool to simulate switched capacitor circuits response. Can any body suggest me a link or book to know the simulation settings/tutorial for that...
 

Below pls. find a Cadence RF measurement tools tutorial:
 
Hi,

I have already read the paper "Simulating switched capacitor filters with spectreRF" found on https://www.designers-guide.org
...But there are some confusions...In paper various parameters are presented like 'maxacfreq' and 'maxsideband' for the pss analysis...i am not able to find the fields for entering these values in pss analysis of cadence...

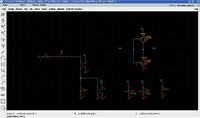
so i used my own sense and have simulated the following circuit with the pss and pac analysis settings given in figures attached...The idea is to simulate an ideal switched capacitor first order low pass filter with cuttoff frequencies of 1000Hz. The non-overlapping clock frequencies are 20KHz and input frequency is 100Hz....The switches used are ideal ones with on resistance of 1Ohm and off resistance of 1TOhm....

The calculated value of Switched capacitor equivalent resistance is Req=1/C0*Fc=1/(1pF*20K) =50M and cuttoff frequency of lowpass filter is 1/(2*pi*Req*C1)=1/(2*pi*50M*3.18pF)=1000Hz....The PROBLEM now is that the simulated value of cuttoff frequency does not agree with the calculated results.. I am not sure what the problem because i am using ideal circuits at this time....I have tried to change the clock frequency, input frequency, switch on resistance, output capacitor value, switched capacitor value but the problem remains the same...One thing which i have observed is that if i decrease the switched capacitor value, the deviation between calculations and simulated results become less but still not close..for example changing capacitor from 10nF to 10pF decreased the deviation but not much..

any help will be highly appreciated...

thanks
 

can any body please help
 

    V

    Points: 2
    Helpful Answer Positive Rating
I tried to modify the circuit a little bit to make it working....Is it the case for Switched capacitor filters that cuttoff frequency of filter should be atleast 100 times less than clock frequency....for considering a resistor equivalence of switched capacitor?
 

Hi, viperpaki007
I've tried a switched-capacitor approach to simulate highpass RC-network. Circuit is the following

Equivalent resistance is equal to 1/(5p*100K)=2M, thus -3db frequency should be 1/(2*pi*75p*2M)=
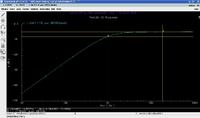
1.06K. the following plot shows the result of pss+pac simulation

The simulated -3db frequency is near its calculated value. The overall attenuation is 4.7 db is due to switching operation, i think.
When i tried to use clock 20k this circuit didn't work as well as when clock 100K.
As for your circuit, i don't think it works like a lowpass RC-network, because (as i understand) switched-capacitor approach lets us simulate grounded resistance (like in highpass RC), but not floating (like in lowpass RC).

Regards, pavel.
 
pavel_adameyko said:
......................
As for your circuit, i don't think it works like a lowpass RC-network, because (as i understand) switched-capacitor approach lets us simulate grounded resistance (like in highpass RC), but not floating (like in lowpass RC).
Regards, pavel.

Pavel, in principle, you are right - as far as the simple S/C equivalence based on the Euler-approach is concerned. However, using the bilinear approximation you also can replace floating resistors.
 
Hi, LvW.
Thank you for your correction. I am not familiar with switched-capacitor approach very well. Maybe you can suggest some books for future reading.
Thanks in advance.
 
Hi,

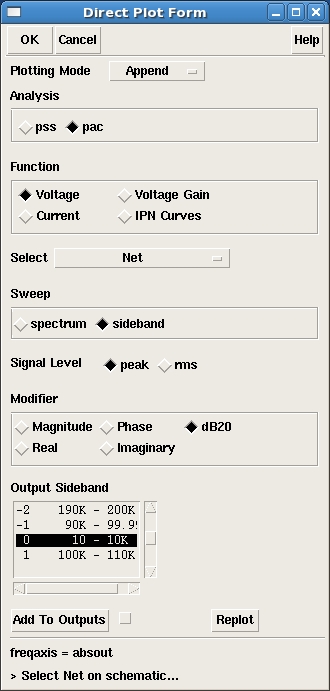
Can you guys please tell me how you obtain that PAC frequency response curve with harmonic=0 ???

I don't know how to obtain that graph with the cadence calculator or on the results -> direct plot .

Please, drive me through these settings. Thanks
 

Hi, kyttaylor.
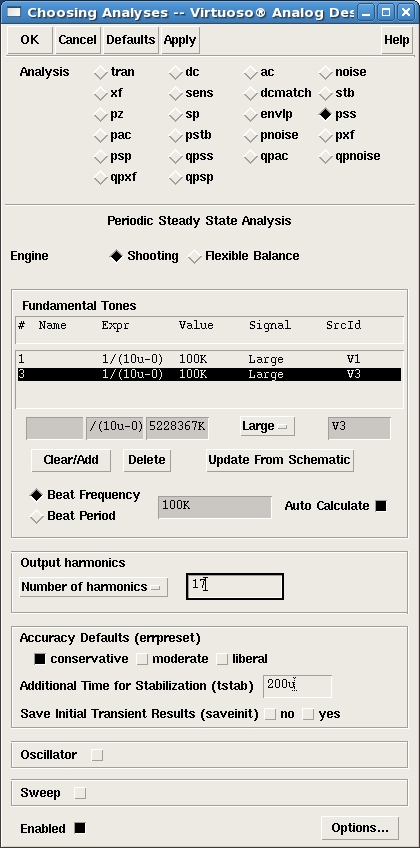
Here are the pss settings:
79_1280824935.jpg

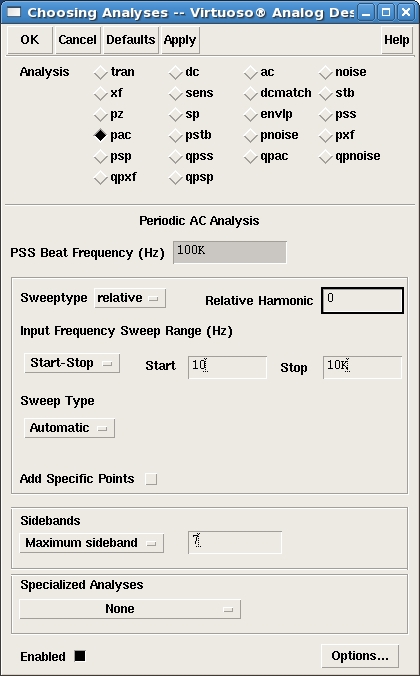
pac settings:
4_1280824957.jpg

and direct plot window:
29_1280825086.jpg

Regards, pavel.
 
Thanks Pavel :)

Added after 2 hours 7 minutes:

I also noticed that you get a more accurate frequency response when the clock switching frequency is 100 times greater than the filter cutoff frequency.

Can somebody please explain why this is the case? Is it because you have a lot more samples ? or because parasitics and noise are reduced at higher clock frequencies ?

Thanks
 

kyttaylor said:
Can somebody please explain why this is the case? Is it because you have a lot more samples ? or because parasitics and noise are reduced at higher clock frequencies ?
I think that's because there are more samples on signal period, so output signal can more precisely track input.
 

kyttaylor said:
.......................
Can somebody please explain why this is the case? Is it because you have a lot more samples ? or because parasitics and noise are reduced at higher clock frequencies ?

Thanks
No, it's not as simple.
You should not forget that the S/C technique is an approximation to time continuous operations. Thus, there are errors when you come closer to the frequency which equals the clock.
In detail: Consider, for example, a simple first order lowpass in S/C technique.
From the time discrete analysis you get infinite at the clock frequency - in contrast to the real RC world. However, since you always have a sample-and-hold-effect at the output of the filter (opamp) this "pole" is converted to a zero at the clock frequency.
But there is still an error in the vicinity of the clock frequency if compared with RC.
That's the reason for a clock which should be higher than the desired cut-off by at least a factor of 50.

Added after 39 minutes:

For your convinience, here is the ac response of a first order S/C lowpass for three different S/C approximations which lead to three different S/C realizations.
No sample-and-hold effect is considered.
For comparison: RC lowpass.
See pdf-attachement.
 
Hi Pavel,
In the simulation setting you showed above i have some confusion for some of the settings....can you please explain...

What do the settings 'Number of harmonics' and 'additional time for stabilization' mean...in pss analysis...what values should i use...

what is the significance of 'sideband' settings in PAC analysis..

and what is the difference between PSS and QPSS anaysis...
 

Hi, viperpaki007.
In pss time for stabilization means the time which circuit needs to reach its steady state. So simulator performs tran analysis for this time and after finishing begins to calculate steady-state response of circuit. Duration of this time depends of circuit which your simulate. The bigger this time the less probability that pss doesn't converge, but for large circuits bigger time for stabilization results in longer simulations - so you can perform several pss and noitce after which value of stabilization time pss works without problems and in following simulations use this value.
Number of harmonics is which number of harmonics of fundamental frequency pss analysis processes, as i understand. The bigger this value the more accurate pss works, but this leads to longer simulation time for circuit. Like in case of stabilization time oyu can perform several simulations and notice after which number of harmonics simulation results stop to differ from each other. As i remember the default value is 7 - almost in all cases it is enough.
Maximum sideband. For example, fundamental frequency is 1 MHz and you perform pac 1KHz - 10 KHz. Maximum sideband, for example 3, means that if you observe the results near 6th harmonic, i.e. 6.001-6.01 MHz at output, pss calculates that the following frequencies influence on your output 3.001-3.01 MHz, 4.001 - 4.01 MHz, 5.001-5.01 MHz, 6.001-6.01 MHz, 7.001 - 7.01 MHz, 8.001 - 8.01 MHz, 9.001-9.01 MHz, i.e frequencies near 6±3 MHz.
That's my explanation - maybe it's not very well, hope that guys correct me if i've made mistake:).
Regards.
 
  • Like
Reactions: issaczy and femsyhs

    femsyhs

    Points: 2
    Helpful Answer Positive Rating
    V

    Points: 2
    Helpful Answer Positive Rating

    issaczy

    Points: 2
    Helpful Answer Positive Rating
Hi, Pavel.
I tried to use all your schematic and the settings you posted, but it's weird that I only got corner frequency much higher than yours.
I don't know what's wrong. Did you set any parameter in your input signal?
Regards,

D
 

Hello everybody!

I truly hope you can help me. In know this thread is old, but this is by the best i could find considering my problem.

I am trying to simulate the response of a simple low pass sc filter. The structure is derived from a classical RC low pass. So all i did was exchanging the resistor with a sc-resistor. My circuit and all settings can be seen in the attatched files. Now here is the thing i just dont understand:

The simulation runs fine and shows a low pass characteristic, which is good. And the pole is changing with different sc-frequencies, which is also good (diffFreq.png).
diffFreq.png
BUT, it does not change in any way when i change any of the cpacitances (diffCap.png). It just shows the exact same behaviour.
diffCap.png


Does anyone know what the problem is??

PhiBar.pngswitch.pngcircuit.pngade.pngpss.pngPhi.pngpac.pngVin.png
 
Status
Not open for further replies.

Part and Inventory Search

Welcome to EDABoard.com

Sponsor

Back
Top