powersys
Advanced Member level 1

- Joined
- Nov 29, 2005
- Messages
- 439
- Helped
- 3
- Reputation
- 6
- Reaction score
- 2
- Trophy points
- 1,298
- Activity points
- 4,981
The following paragraph was copied from Theodore Wildi's textbook:
By the way, what does the quoted sentence in bold above mean?
Thanks.

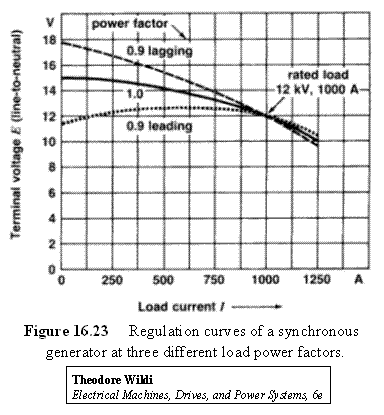
Do you think the curves (e.g. trend) in Figure 16.23 are correct or not?When a single synchronous generator feeds a variable load, we are interested in knowing how the terminal voltage E changes as a function of the load current I. The relationship between E and I is called the regulation curve. Regulation curves are plotted with the field excitation fixed and for a given load power factor.
Figure 16.23 shows the regulation curves for the 36 MVA, 21 KV, 3-phase generator. They are given for loads having unity power factor, 0.9 power factor lagging, and 0.9 power factor leading, respectively. In each of the three cases, the value of Eo was set so that the starting point for all the curves was the rated line-to-neutral terminal voltage (12 kV) at rated line current (1000 A).
By the way, what does the quoted sentence in bold above mean?
Thanks.
