v1p3r32
Newbie level 6

Hi. I have a question regarding matlab nyquist plot.
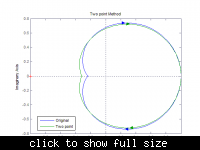
the above graph was plot using the following code.
w = {0.01, 1.2}
w =
[0.0100] [1.2000]
>> g = tf([-0.024 -0.22 1],[0.00002 0.00138 0.03529 0.4056 2.04913 4.4275 3.75 1]);
>> nyquist(g,w);
>> hold on;
>> FOPTD=tf([1],[2.52 1],'OutputDelay', 1.64);
>> nyquist(FOPTD,w)
>> title('Two point Method')
>> h = legend('Original','Two point',4);
May I ask how do I get rid of the curve above the real axis?