memeth
Newbie level 5

- Joined
- Apr 17, 2010
- Messages
- 8
- Helped
- 0
- Reputation
- 0
- Reaction score
- 0
- Trophy points
- 1,281
- Location
- Milano, Italy
- Activity points
- 1,348
Hi all,
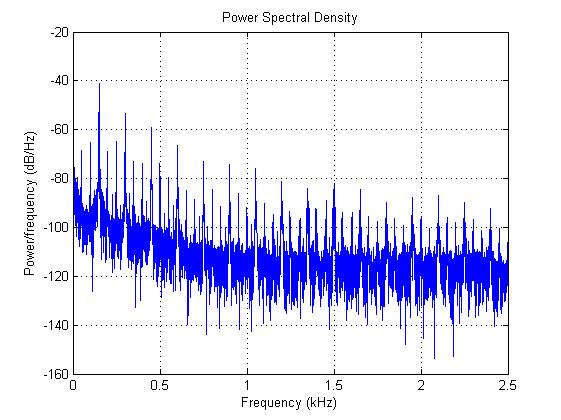
I have a signal vector (Fase1vuoto1) with length(Fase1vuoto)... I would like to obtain power values of each frequency component. I used Hpsd=dspdata.psd(...) function and i can obtain the Frequency versus Power/frequency plot. But, i need them in two different vectors. How can i obtain such vectors one for frequency, one for power/frequency.
Fs=5000;
nfft=2^nextpow2(length(Fase1vuoto1));
Pxx=abs(fft(Fase1vuoto1,nfft)).^2/length(Fase1vuoto1)/Fs;
% Create a one-sided spectrum
Hpsd=dspdata.psd(Pxx(1:length(Pxx)/2),'SpectrumType','Onesided','Fs',Fs);
By the way, what is the benefit in using "one-sided" or "two-sided" spectrum? I think "two-sided" is the logical one. But i am confused...
figure(1)
plot(Hpsd)