Continue to Site

Welcome to EDAboard.com

Welcome to our site! EDAboard.com is an international Electronics Discussion Forum focused on EDA software, circuits, schematics, books, theory, papers, asic, pld, 8051, DSP, Network, RF, Analog Design, PCB, Service Manuals... and a whole lot more! To participate you need to register. Registration is free. Click here to register now.

positive and negative feedback !

Status
Not open for further replies.

imar

Full Member level 1
Full Member level 1
Joined
Mar 24, 2008
Messages
95
Helped
2
Reputation
4
Reaction score
1
Trophy points
1,288
Activity points
2,055
difference between positive and negative feedback

hi freinds;

we have spoken later in (Problem with LDO design) about the positive and the negative feedback for the error amplifier and hopefully as LvW said, the PM is not always calculated by taking the origin in -180° and LVW has well explained it.
so at this point, a question could be put: what is the difference between having a positive feedback or a negative one? how could we choose between them?
in what point does this feedback affect ?

thanks for information in advance!

regards
 

imar said:
hi freinds;
we have spoken later in (Problem with LDO design) about the positive and the negative feedback for the error amplifier and hopefully as LvW said, the PM is not always calculated by taking the origin in -180° and LVW has well explained it.
so at this point, a question could be put: what is the difference between having a positive feedback or a negative one? how could we choose between them?
in what point does this feedback affect ?

Hi imar,
hopefully there is no misunderstanding between us. I suppose you are referring to my reply dated August 26th in the topic "problem with LDO design". However, my contribution did not at all touch the question of POSITIVE fedback.
My only point was: For stabilty analyses of systems with NEGATIVE feedback (like LDO, PLL, ...) using the Nyquist or Bode plots there are two basic alternatives in use:
1.) Check the loop gain phase against 0 deg (Nyquist point at +1), or
2.) Check the phase of the INVERS (Correction: NEGATIVE) loop gain against 180 deg (Nyquist point at -1).
That´s all - and this has nothing to do with POSITIVE feedback.

Quite another subject is your second question: Difference between positive and negative feedback.
That´s not so easy to answer, since in nearly all feedback systems at a certain frequency the negative feedback (intentionally designed) turns over into positive feedback. To explain this, I will create a small drawing and I will post in somewhat later.
Regards
 

    imar

    Points: 2
    Helpful Answer Positive Rating
thank you LvW!
first, there is no misunderstanding between us!
i am trying only to learn about differents issues that i haven't access yet, and with your great help, i hope to inderstand it.

you are really generous and i am so proud to have someone like you how gives me a hand.
 

Hi imar !

In the attached pdf file I have written down some basics concerning feedback - with emphasis on the difference between negative and positive feedback.
This difference is based on a theoretical definition - however it has a rather good practical background.
And everybody should know: Each negative feedback system will turn into positive feedback above a critical frequency. The only question is whether at this point the stability criterion is met or not.
Hope this helps a bit to clarify things.
With regards
LvW
 

There is one interesting property of the sensitivity function I forgot to mention:

As you can see in the Nyquist plots, the MINIMUM of the magnitude from 1/S - identical to the MAXIMUM of the magnitude of S - gives the minimum distance between the corresponding Nyquist plot and the CRITICAL point (-1 resp. +1)
This leads to a new stability figure which cannot be found in most books on control theory:

The MINIMUM of the inverse sensitivity function (1/S) is identical to the so called "vector margin" which can be seen as a combination of the well known phase and gain margins.
This is important insofar as neither the phase nor the gain margin alone can give a sufficient information on the stability properties of a system.
The vector margin is something like a composite stability margin and is relatively simple to compute resp. to simulate.

One additional coment: (1/S)min=(1/Smax)
Therefore, the vector margin can be found without the Nyquist diagram by evaluating the peak of the diagram showing S as a function of frequency.
 

hi LvW!

i really enjoyed the pdf attachement in which you define the difference between positive and negative feedback.

so, as you said, a negative feedback can turn into positive one after a critical frequency,and we can manage to know the nature of this feedback by simply draw the sensitivity function and pointing at the UGF to see in which side does it go.
--> then, we can know that our system is reaching a critical frequency if we designed to have a negative feedback and it appears, by virtu to the S function, to be a positive one!
second, now by the use of the vector margin we can define an other condition to ensure stability, this condition could be the one that Ashish-chauhan asked for in one of the last discussion in 'problem with LDO design' in page 3, so could it be?

thanks

regards
 

imar said:
so, as you said, a negative feedback can turn into positive one after a critical frequency,and we can manage to know the nature of this feedback by simply draw the sensitivity function and pointing at the UGF to see in which side does it go.
--> then, we can know that our system is reaching a critical frequency if we designed to have a negative feedback and it appears, by virtu to the S function, to be a positive one!

I suppose by using "UGF" you mean "unity gain follower", don´t you ?
Therefore, I like to point out that I haved used the follower only as an example.
Of course, the definition and the meaning of the sensitivity function S applies to all amplifier configurations with feedback.
 

hi LvW!

i used UGF as unity gain frequency.
 

OK, it was a rather quick reply !
However, the frequency with S=1 is NOT the unity gain frequency !
 

you are right,

it was my mistake. S=1 means that the ampli has a unity gain frequency and it has not relation with UGF.
 

imar said:
you are right,
it was my mistake. S=1 means that the ampli has a unity gain frequency and it has not relation with UGF.

Your formulation is not clear for me as you now suddenly make a difference between "unity gain frequency" and "UGF".

To clarify: S=1 means simply that there is a frequency (we can name it fs) for which the sensitivity of the system (as defined before) is "1" - and at the same time there is a transition from negative to positive feedback at this frequency fs.
 

thanks for explanation LvW!
 

Hello imar !

Are you interested to know the vector margin Vm of your LDO system ?

Well, up to now I didn´t tell you how to measure/simulate it. It´s very simple by using the inverse of the Sensitivity function.

1.) In each control system the Sensitivity function S can be derived directly as the output of the difference block which compares the required value (leading parameter) with the actual value which is fed back.
This requires that you have access to the difference block output, which very often is the case. However, unfortunately NOT in your case.
2.) Therefore, ground the negative input of your error amplifier and add an ideal "difference block" (available in each simulation program as an analog behaviour model) directly in front of the plus terminal of the error amp. The inputs for this block are the reference voltage (-) and the resistive divider output (+).
By doing this you simply have transferred the difference function of the first opamp stage out of the amplifier in order to have access to it.
3.) Thats all. Then, introduce an ac voltage of 1V in series with the reference voltage and run a classical ac simulation (of course, all DC voltages applied).
4.) The output voltage of the diff. block (positive opamp input) gives you the sensitivity function S(jw).
5.) Display the magnitude of S and measure |Smax|. Then, Vm=1/|Smax|.
________________
What is your value for Vm ? It should be at least 0.6...0.7 (empirical value).
Regards
 

Hello LvW!

it is very useful to know the value of VM.
But, when i tried to apply the instructions that you posted, i found a problem to choose 'the difference bloc' in analoglib from CADENCE. could a balun be the adequate one? because it is from rflib.

thanks!

Added after 12 minutes:


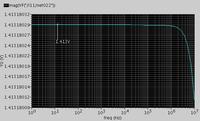
now, i tried the simulation using this difference bloc and i achieved all the instructions, and finally you will find posted the response with Smax=1.413


so Vm=1/Smax= 0.7077

and hopefully as you said Vm is around the values that you estimated!

thank you LvW!
 

Hi imar,

no, the picture does not look realistic.

I cannot imagine that you don´t find a "difference block". You simply need a unit which is able to simulate the ideal difference between two signals. If there is no other chance you can use an IDEAL opamp connected as a differential amplifier.

In the pdf-attachement I show you an example how the S-function should look like.
 

Status
Not open for further replies.

Part and Inventory Search

Welcome to EDABoard.com

Sponsor

Back
Top