endyson
Newbie level 4

anyone who can help me explain the plot below?
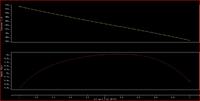
I am using hspice extracting parameters of nmos transistors, I set the transistor worked in the saturated region, fixed the gate voltage and sweeped the drain voltage, but got result shown below, the upper is the drain current(Y axis) versus drain voltage (X axis) ,the plot below is the derivative of the upper, Y is the derivative X is the drain voltage, transistor size is w=2u l=0.35u.
anyone who can explain way the derivative of the current decrease and then increase as the drain voltage growing?
listed here my netlist,
nmos parameters
***************************************title
.lib 'sm046005-1f.hspice' typical
***************************************library
m1 d g gnd gnd nmos_3p3 w=2u l=0.35u
***************************************
vg g gnd dc 1
vd d gnd dc 3.3
***************************************
.dc vd 1 3 0.01
.options post
.end
 [/img]
I am using hspice extracting parameters of nmos transistors, I set the transistor worked in the saturated region, fixed the gate voltage and sweeped the drain voltage, but got result shown below, the upper is the drain current(Y axis) versus drain voltage (X axis) ,the plot below is the derivative of the upper, Y is the derivative X is the drain voltage, transistor size is w=2u l=0.35u.
anyone who can explain way the derivative of the current decrease and then increase as the drain voltage growing?
listed here my netlist,
nmos parameters
***************************************title
.lib 'sm046005-1f.hspice' typical
***************************************library
m1 d g gnd gnd nmos_3p3 w=2u l=0.35u
***************************************
vg g gnd dc 1
vd d gnd dc 3.3
***************************************
.dc vd 1 3 0.01
.options post
.end
 [/img]
