Eng.Salwa1
Newbie level 4

Hello everyone.
I have got a signal using digital oscilloscope from the mains 230V.
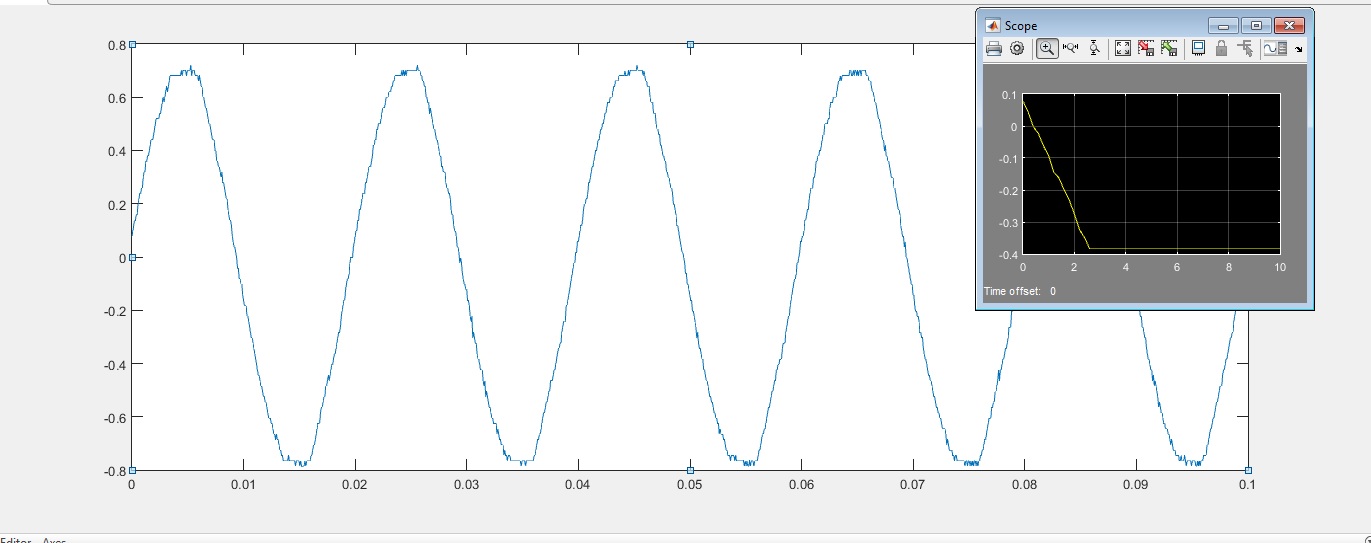
I plotted the data: time vs volt using matlab and i got it. However, when i tried to plot the same data using From my space in simulink I got different shape and its not even a wave form
I had two parameters in my workspave which are time and volt and then i used
ts = timeseries(volt,time); to get the two parameters in one matrix
please have a look at the two waveforms from plotting tool in matlab and from scope of simulink
the original wave form maximum amplitude is 0.8 Volt and the neasuring time -2.5 to 2.5 a total of 5 seconds
I have zoomed in to get a better clarity.
Regrads.
I have got a signal using digital oscilloscope from the mains 230V.
I plotted the data: time vs volt using matlab and i got it. However, when i tried to plot the same data using From my space in simulink I got different shape and its not even a wave form
I had two parameters in my workspave which are time and volt and then i used
ts = timeseries(volt,time); to get the two parameters in one matrix
please have a look at the two waveforms from plotting tool in matlab and from scope of simulink
the original wave form maximum amplitude is 0.8 Volt and the neasuring time -2.5 to 2.5 a total of 5 seconds
I have zoomed in to get a better clarity.
Regrads.