Continue to Site

Welcome to EDAboard.com

Welcome to our site! EDAboard.com is an international Electronics Discussion Forum focused on EDA software, circuits, schematics, books, theory, papers, asic, pld, 8051, DSP, Network, RF, Analog Design, PCB, Service Manuals... and a whole lot more! To participate you need to register. Registration is free. Click here to register now.

Magnetic hysteresis loop

Pixelx

Newbie level 5
Newbie level 5
Joined
Aug 25, 2024
Messages
9
Helped
0
Reputation
0
Reaction score
1
Trophy points
3
Activity points
131
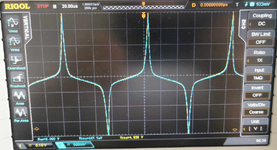
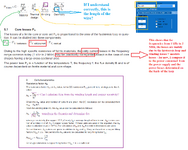
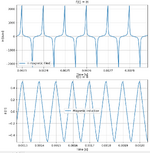
Hello, I designed an H-bridge for testing magnetic materials in transformers. Current is measured using a 1:250 transformer with a 22ohm measuring resistor + 470pF in parallel on secondary side. Current transformer time constant 6.53ms. The magnetization error in relation to the main current is 0.25%.

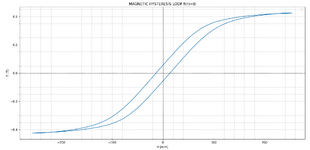
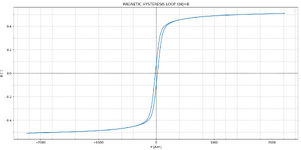
The hysteresis loop I received for 10kHz is for a square signal (voltage) and "triangular" current in the datasheet, induction B = 440mT and current H = 1200A/m are for sine, I received 490mT for 1200A/m

Other data:
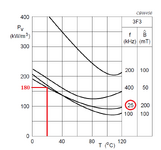
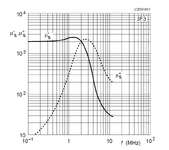
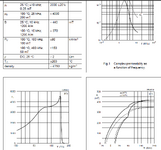
Core: E32/16/9-3F3 FERROXCUBE
Al: 2300nH
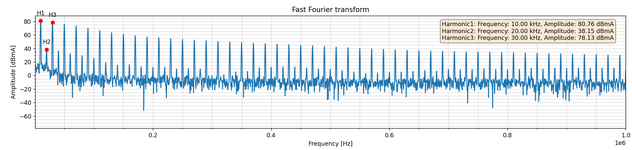
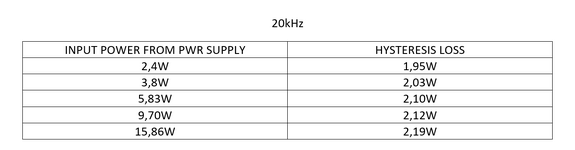
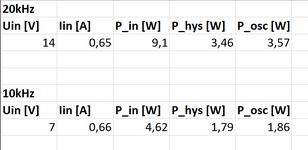
I obtained hysteresis losses of 1.81W for a non-sinusoidal signal (large number of harmonics)
Hysteresis loss per cycle: 29.31 J/m³
Frequency 10kHz
RMS current 11.74A
PEAK 41.31A
N_prim = 4
N_sec = 20
L_prim = 40 uH
le = 74mm
Ae = 83 mm2
Ve = 6180 mm3


What do you think about these results about Hc and Br, hysteresis losses and B and H, are they correct?
 

Attachments

  • 2323.PNG
    2323.PNG
    106.3 KB · Views: 64
  • 234234234.PNG
    234234234.PNG
    84.7 KB · Views: 58
  • 23423423445645.PNG
    23423423445645.PNG
    122.8 KB · Views: 53
Last edited:
Looks plausible, but comparing your BH curve to the one in the material datasheet (at 25C) shows it's very different. Mainly the Br (the y-intercept) in the datasheet is much larger than your data.

How are you measuring B(t)? If you're estimating it based off the datasheet information for the core, then that's likely going to throw you off, especially due to uncertainty in the core's air gap. Usually this sort of characterization is done with thin toroidal cores, in order to ensure no air gap and uniform field.
 
what is the purpose of the testing ?
I have a lot of different recycled cores leached from various power supplies. I want to use them for my own projects and mainly it is my passion for the electromagnetic field.
Usually this sort of characterization is done with thin toroidal cores, in order to ensure no air gap and uniform field.
Is that why my Br is shifted relative to the documentation?
Because the core is not perfectly assembled?
But such a measurement means that I have more reliable data than from the datasheet? Especially since the manufacturer tests the core for one harmonic and here I have a lot of harmonics like in a real system. I understand this correctly?

BH curve to the one in the material datasheet (at 25C) shows it's very different. Mainly the Br (the y-intercept) in the datasheet is much larger than your data.
Yes, you are right, Br is different, but this is probably because the EE core has a gap resulting from inaccurate grinding and inaccurate assembly of the core??
I also did a test for 250A/m (screen below) and got a result of 440mT. This is probably due to smaller amplitudes of individual harmonics? Of course, Br is different, but the characteristics with lower saturation reflect the documentation better. Hc is 15A/m

How are you measuring B(t)?
measures the voltage at the output and calculate the integral. Magnetic induction B is the integral of voltage over time


I made an FFT(screenshot below) of the current and it shows that the 3rd harmonic is 2dB lower than the 1st, which shows that individual harmonics have large values. Does a larger number of harmonics result in higher core losses than stated by the manufacturer?

I got these loss results:
Energy loss per volume: 29.31 J/m³ (10kHz)
Power loss per volume: 293.13 kW/m³ (10kHz)
Power hysteresis loss: 1.81 W (10kHz)

For hysteresis loops below in the attachment 250A/m
Energy loss per volume: 21.80 J/m³ (10kHz)
Power loss per volume: 218.02 kW/m³ (10kHz)
Power hysteresis loss: 1.35 W (10kHz)

I calculated it like this:

I integrated the hysteresis loops numerically and saved the result in a variable hysteresis_loss_energy the result is in J/m^3


# Conversion to kW/m^3
hysteresis_loss_energy_kW_per_m3 = (hysteresis_loss_energy * freq) / 1000

# Calculation of hysteresis losses in watts
power_hysteresis_loss = hysteresis_loss_energy * freq * Ve

Did I calculate it correctly?

I compared it with the data sheet (data for the 1st harmonic) and the result is about 180kW/m3. What do you think about it?
It seems to me that the losses are influenced by harmonics and the result I get is for the real case in which this transformer will work.
For the smaller loop, the losses amount to 218kW/m^3

To be more sure of the calculations, I performed a comparative test with the current probe from Rohde and Schwarz


Yellow - R&S
Blue - my CT

Current from R&S = 4.939A RMS
My CT Transformer
I sec = 0.04477 / 22 = 0.02035A
I prime = 0.02035A * 250 = 5.0875A

Absolute = | 4.939 - 50.0875| = 0.1485
Relative = (0.1485 / 4.939) * 100% = 3%

Relative error 3%
Magnetization error 0.25%
 

Attachments

  • FFT.PNG
    FFT.PNG
    189.8 KB · Views: 54
  • Bez tytułu.png
    Bez tytułu.png
    30.4 KB · Views: 46
  • 1577540900_1724596958.png
    1577540900_1724596958.png
    133.6 KB · Views: 48
  • 345345345.PNG
    345345345.PNG
    530.3 KB · Views: 35
Last edited:
In the real world you would run 3F3 at 100mT pk @ 100kHz, and maybe 200mT pk at lower frequencies - if you can run at these peak flux densities

say 200mT pk @ 10kHz - then your measured losses should be lower and in line with the data sheet.
 
Is that why my Br is shifted relative to the documentation?
Because the core is not perfectly assembled?
That's my first guess at why your Br and ua are much lower than the values in the datasheet, but your Bsat looks similar.
But such a measurement means that I have more reliable data than from the datasheet?
Depends on what your objective is. If your objective is to characterize the core material itself, then your results are off. If your objective is to characterize this particular core assembly (as opposed to the properties of the material itself), then your measurements are probably valid, but only for this particular core assembly.
Especially since the manufacturer tests the core for one harmonic and here I have a lot of harmonics like in a real system. I understand this correctly?
AFAIK the shape of the waveforms doesn't significantly impact core loss. Just the peak to peak B ripple and frequency.
measures the voltage at the output and calculate the integral. Magnetic induction B is the integral of voltage over time
Assuming this is on a secondary winding which carries no current. that should be fine.
I made an FFT(screenshot below) of the current and it shows that the 3rd harmonic is 2dB lower than the 1st, which shows that individual harmonics have large values. Does a larger number of harmonics result in higher core losses than stated by the manufacturer?
Again, I don't expect the results to change significantly based on whether your applied B waveform is sinusoidal or triangular. So long as the min/max of the waveform is the same, the resulting BH curve should still take the same shape. Changing the waveform shape just changes the rate at which you traverse the BH curve, not its shape. I'm sure that under extreme circumstances (like if your waveform is non-monotonic, or if your frequency is very high) then this assumption breaks down, but I don't think that's relevant in your case.
Did I calculate it correctly?
I can't see any flaw in your math. But it's hard to verify it too...
I compared it with the data sheet (data for the 1st harmonic) and the result is about 180kW/m3. What do you think about it?
I think you might be misunderstanding the meaning of the fig 7 data. The different curves aren't for different harmonics of a waveform. Those frequencies refer to the fundamental frequency at which core loss was measured. That 180kW/m3 value you're pointing to is measured with a fundamental frequency of 10kHz and a peak flux density of B=200mT. Your experiment has a different frequency and B, so your value should be different (I'm guessing somewhat higher).

Sometimes the datasheet gives equations for estimating core loss at arbitrary f and B, but I don't see that for this material. If you redo your experiment under conditions matching those in fig 7 that will allow for easier comparison.
 
Depends on what your objective is. If your objective is to characterize the core material itself, then your results are off. If your objective is to characterize this particular core assembly (as opposed to the properties of the material itself), then your measurements are probably valid, but only for this particular core assembly.
The goal is to estimate the capabilities and losses of unknown cores and have knowledge of what I currently have in hand. Determining remanence, coercivity and maximum induction B if possible, then more or less estimate what type of core it is, e.g. 3F3 or 3C95 etc. I will also be happy and I think it can be estimated to some extent, but it is not the main goal. From what I have read, the accuracy of ferrites is not ideal and I consider the results of +-10% to be reasonable (440mT vs 490mT is approximately 10%), the aging process of the material also matters plus, what the manufacturer tests on a uniform core in them lab. It's important to me what I have in real case in which I will use the core for the DC/DC converter. I also want to check the core, for which I even have documentation in order to check how it actually behaves with a voltage rectangle and not for 1 harmonic.


I just want to be sure that what I measured reflects reality and what is happening in this material.

Assuming this is on a secondary winding which carries no current. that should be fine.
yes on the secondary side

Again, I don't expect the results to change significantly based on whether your applied B waveform is sinusoidal or triangular. So long as the min/max of the waveform is the same, the resulting BH curve should still take the same shape. Changing the waveform shape just changes the rate at which you traverse the BH curve, not its shape. I'm sure that under extreme circumstances (like if your waveform is non-monotonic, or if your frequency is very high) then this assumption breaks down, but I don't think that's relevant in your case.

If we have a resistor and connect a distorted waveform to it, the power loss emitted on it depends on each harmonic of this waveform. The same is true for magnetic material, which also has its own bandwidth on which the losses in the core depend. This is also given by the complex graph of u' and u'' (I placed it below). Each harmonic will cause losses in the core, so the losses I calculate are reliable in my opinion. Below I present a test that could confirm this

The BH curve should have the same shape, but there is also some % error + my core is not the same shape as the one tested in the lab when they created the documentation. The most important thing for me is to see exactly what I am dealing with and what exactly I will get from what I have on the table in front of me.
These losses must result from something for distorted waveforms, the same is true for a resistor or other element.


In order to confirm my calculations and results + documentation, I came up with this idea.
Loop losses + eddy currents cause the core to heat up? Do I understand correctly? I would like to ask for confirmation of this.

Frequency: 20 kHz

The bridge is powered by a regulated DC power supply. I applied a voltage to it that is on the edge of core saturation. Power consumption 2.4 W from the power supply, calculations of hysteresis loop losses + eddy currents in this amounted to 1.95 W. If I remember correctly, the core temperature was higher than the ambient (I tested something earlier and did not write down the temperature, but it is not so important at this point). The remaining losses are probably mosfets and other elements.

The more I saturated the core, the more power I drew from the power supply, e.g. for 15.86 W, the losses on the loop were 2.19 W, so they increased slightly, which is true, the inductance disappears, and practically the wire resistance remains, which heats the core. The waveform contains many harmonics that must in themselves affect the losses in this core, which confirms this type of thinking and real physics.

In order to better confirm the hysteresis loss 1,95W I measured the core temperature and assumed a 10k/W thermal resistance of the core. The thermal losses were 1.8W for a given temperature increase relative to the environment. This confirms 100% for me the correctness of the calculations performed and shows the actual hysteresis loop. Thermal energy is my feedback, which produces loop loss power + eddy currents.

The energy must be correct according to the law of conservation of energy. And the energy consumed from the power supply was always higher than the one I calculated based on loop losses. It would be suspicious if I obtained greater losses than the consumption from the power supply, but this was never the case.

What do you think about this test and does it confirm 100% the correctness of the obtained results of the hysteresis loop and its shape?
The data is similar to what the manufacturer provides, as you have seen for yourself.


----EDIT.

I wound the winding again more precisely and carefully so that the end of the wire did not go through the entire winding from top to bottom. I noticed that for the EE core, when winding the wires, they do not adhere perfectly to the carcass.

For E32/16/9-3F3 1400A/m I obtained 480mT

I also did a test with the ETD34/17/11 - 3F3 core
The winding definitely adheres better to the carcass because it is round and for 1200A/m I obtained 463mT, the manufacturer wrote about 440mT.

Coercivity and remanence are the same as for the EE and ETD cores, the losses in the core are similar.

I think that this test with the ETD core and the inaccuracy of the winding at EE definitely affect the accuracy of the measurement and the losses in the core confirm the test that I wrote earlier.
I have no more ideas and I think that the measurement results reflect reality 100%.
What is your opinion?
 

Attachments

  • 23345345345.PNG
    23345345345.PNG
    16.8 KB · Views: 25
  • Przechwytywanie.PNG
    Przechwytywanie.PNG
    42.7 KB · Views: 23
Last edited:
The goal is to estimate the capabilities and losses of unknown cores and have knowledge of what I currently have in hand. Determining remanence, coercivity and maximum induction B if possible, then more or less estimate what type of core it is, e.g. 3F3 or 3C95 etc.
[/QUOTE]
Your setup is likely good enough to tell the difference between some core materials (especially if you compensate for the air gap in your analysis). Telling some materials apart (like 3C90, 3C91, 3C92, etc) will be a lot trickier since their main difference is their thermal dependence.
If we have a resistor and connect a distorted waveform to it, the power loss emitted on it depends on each harmonic of this waveform. The same is true for magnetic material, which also has its own bandwidth on which the losses in the core depend. This is also given by the complex graph of u' and u'' (I placed it below). Each harmonic will cause losses in the core, so the losses I calculate are reliable in my opinion. Below I present a test that could confirm this
It's still unclear why you keep bringing up harmonics... It sounds like you're assuming that you can break a waveform into harmonics, calculate the power dissipated of each harmonic, then sum those powers to get the power dissipated by the original waveform. That's not valid, even for linear systems.

As for whether core loss can be treated as frequency dependent or not:
Core loss is typically broken down into hysteresis loss, which is modeled as nonlinear but frequency-independent, and eddy current loss, which are treated as linear but frequency dependent (complex permeability u' and u'' emerge from eddy current loss). If you know your losses are dominated by eddy current losses, then yes you can assume your system is linear. However, I think the experiments you've shown so far are dominated by hysteresis loss.

Actually for eddy current losses, I think whether they can be treated as linear and/or frequency dependent depends on what you're independent variable in the model is. For example, eddy current losses should be linear with respect to B (Faraday's law), but must therefore be nonlinear with respect to H. But eddy current losses should be frequency independent with respect to winding voltage (thus independent of the waveform shape), but proportional to frequency with respect to magnetizing current (thus dependent on waveform shape). This document does a better job of explaining it: https://www.ti.com/lit/ml/slup124/slup124.pdf

In reality there's more going on than just these two independent power loss mechanisms. For example, some core materials have a frequency exponent term greater than 2, which can't be explained by a simple model of eddy currents in a bulk material. This is often attributed to the effective resistivity dropping at higher frequency due to the inhomogeneous nature of the ferrite. This white paper has some interesting discussion: https://ridleyengineering.com/images/phocadownload/7 modeling ferrite core losses.pdf

Anyways if you keep doing these experiments you'll probably understand this a lot better than me in no time.
 
It's still unclear why you keep bringing up harmonics... It sounds like you're assuming that you can break a waveform into harmonics, calculate the power dissipated of each harmonic, then sum those powers to get the power dissipated by the original waveform. That's not valid, even for linear systems.

If you decompose the Fourier transform signal and calculate the power of each harmonic, the sum of the power of these harmonics will be equal to the power of the original signal, even if this signal is distorted. This follows from Parseval's theorem.

Parseval's theorem states that the sum of the squares of the Fourier coefficients (i.e. the power of individual harmonics) equals the total signal power in the time domain. In other words, the total energy of the signal in the time domain is equal to the total energy in the frequency domain.

If a signal is distorted, it means that it will contain more harmonics, but the sum of the powers of these harmonics (both fundamental and higher) will correspond to the total power of that signal.

Having an iron core it is often said that its bandwidth is up to 1 kHz (50 Hz transformers) which means that it is not able to transfer higher harmonics of the distorted signal?


And what do you think about the method in which I presented how I determined the power losses in the core? And what do you think about these numerical values of losses?
I described earlier that I verified it with the power drawn from the power supply and based on thermal resistance where I estimated the thermal energy.


How to calculate the maximum power that a core can transfer? How to estimate it? For a core with a gap, it can be calculated from energy, but what about a core without a gap? For example, I have an ETD34/17/11 - 3F3 core, and how can I know if it is suitable for a 500W power supply?
 

Attachments

  • 34345345.PNG
    34345345.PNG
    5.9 KB · Views: 21
Last edited:
If you decompose the Fourier transform signal and calculate the power of each harmonic, the sum of the power of these harmonics will be equal to the power of the original signal, even if this signal is distorted. This follows from Parseval's theorem.

Parseval's theorem states that the sum of the squares of the Fourier coefficients (i.e. the power of individual harmonics) equals the total signal power in the time domain. In other words, the total energy of the signal in the time domain is equal to the total energy in the frequency domain.

If a signal is distorted, it means that it will contain more harmonics, but the sum of the powers of these harmonics (both fundamental and higher) will correspond to the total power of that signal.
Thanks for the correction. In my head I somehow conflated RMS and power, and had written out a proof that the sum of RMS values of harmonics is not equal to the RMS of the original waveform, which is true but obviously useless in hindsight.
And what do you think about the method in which I presented how I determined the power losses in the core? And what do you think about these numerical values of losses?
I described earlier that I verified it with the power drawn from the power supply and based on thermal resistance where I estimated the thermal energy.
I don't think estimating core losses from core temperature is valid, unless you have already "calibrated" the effective thermal impedance in your setup via temperature measurements with a known core loss. And that calibration will likely be very delicate, depending on core shape, orientation, exposure to airflow, etc. And you would have to ensure that heat from the windings do not contribute to the core heating, which is very difficult in practice.

As for your earlier calculations of "Energy loss per volume," I really can't tell whether they were calculated correctly without the raw data. Can't integrate a hysteresis loop by eye. One thing maybe worth trying is measuring actual power absorbed by the transformer by measuring primary current and voltage simultaneously and using your scope's math function to calculate average power for you. This will include winding losses as well, but you can estimate that if you know the winding ESR (at your fundamental frequency, at least). Compare that result to your calculations based on the BH loop.

How to calculate the maximum power that a core can transfer? How to estimate it? For a core with a gap, it can be calculated from energy, but what about a core without a gap? For example, I have an ETD34/17/11 - 3F3 core, and how can I know if it is suitable for a 500W power supply?
Good question. I think one of my reference books had an explanation of how core manufacturers derive curves of max power transmission (which is a function of shape, material, frequency, temperature, and whether the flux swing is bipolar or unipolar). IIRC it's not dependent on air gap, except for flyback (which is its own topic). Let me see if I can dig it up.
 
Hi,

loss of a core:
in time domain: you multiply I(t) with V(t) to get P(t). Integrate it over a full wave. This is the loss over a full wave.

in frequency domain: (I´m not 100% sure about the method. But only the REAL parts are the lossy parts)
* you need to use a sine voltage as excitation (oterwise a more complex mathematical method is needed)
* you need to take the current, but important!! phase related to the voltage!!
* then you may perform an FFT. The result of an FFT has REAL but also IMAGINARY part.
* then add up using squares the REAL (lossy) part amplitudes only
--> this should give the total of the real (lossy) RMS current.
* multiply this with the excitation RMS voltage. To get the lossy power.

****
I prefer the first method. It is rugged and correct.

Klaus
 
I don't think estimating core losses from core temperature is valid, unless you have already "calibrated" the effective thermal impedance in your setup via temperature measurements with a known core loss. And that calibration will likely be very delicate, depending on core shape, orientation, exposure to airflow, etc. And you would have to ensure that heat from the windings do not contribute to the core heating, which is very difficult in practice.
The temperature test was not supposed to show me the result exactly up to 10%, I even wanted to estimate that the results were not significantly wrong. I did not saturate the core then, it worked nicely in a loop, so the losses included hysteresis and eddy current losses. I only calculate hysteresis. I was remember about the eddy current losses and the winding resistance losses, it is true, but they are not that large in percentage terms compared to the hysteresis losses at such a moment of core operation.
I didn't even know the thermal resistance of the core, so I estimated it. This gave a result similar to the calculations in the program and a result similar to the power consumption of the power supply. So you can't hide it, but the energy has to match.
To sum up, the temperature test was supposed to show me that the results made sense.
What do you think, did it make sense?


Regarding power measurement, it's a good idea. So, measure the voltage drop on the primary winding with an oscilloscope and measure the current, multiply the voltage and current waveforms by read the average power value?

loss of a core:
in time domain: you multiply I(t) with V(t) to get P(t). Integrate it over a full wave. This is the loss over a full wave.
What exactly do you mean by over full wave? Don't saturate the core? If it saturates, I will have losses in the cable. In my opinion, I can't saturate it, it must work normally in a loop close to saturation and then measure the voltage and current and count the power?

Good question. I think one of my reference books had an explanation of how core manufacturers derive curves of max power transmission (which is a function of shape, material, frequency, temperature, and whether the flux swing is bipolar or unipolar). IIRC it's not dependent on air gap, except for flyback (which is its own topic). Let me see if I can dig it up.

oh great, I will be very grateful for such information and help on how to approach it. Even more so now that we have information about the core itself and its capabilities.
 
Last edited:
What exactly do you mean by over full wave?
INTEGRATE over TIME.
TIME = 1 full wave = period time

Don't saturate the core?
The degree of saturation surely has influence on loss.
So it´s pn you to determine at which degree of satuartation you want to know the loss.

If it saturates, I will have losses in the cable
Copper loss?. For sure there is copper loss at any time. (With and without saturation)
Most copper loss is caused by ohmic (DC) resistance: P = I(RMS) * I(RMS) * R.
Additional copper losses are caused by proximity effect and skin effect. I expect both to be frequency dependent.

Klaus
 
I didn't even know the thermal resistance of the core, so I estimated it.
This sort of makes it unreliable even as a sanity check for other measurements. Thermal behavior is at least as complicated to accurately model as magnetic behavior, so a guesstimated model of one shouldn't be used to check the other. Stick to more direct methods like Pc=I*V.

What exactly do you mean by over full wave? Don't saturate the core? If it saturates, I will have losses in the cable. In my opinion, I can't saturate it, it must work normally in a loop close to saturation and then measure the voltage and current and count the power?
Saturation will cause the current to increase, which will increase the copper losses in the winding. But this can still be corrected for, at least to a first order. So instead of Pc=V*I it would be Pc=(V-I*Rcu)*I, where Rcu is the effective series resistance of windings at your excitation frequency.
oh great, I will be very grateful for such information and help on how to approach it. Even more so now that we have information about the core itself and its capabilities.
I couldn't find my Keith Billings book, but I did find my old Epcos/TDK reference book on ferrites. Actually I found a pdf version, here you go: https://www.tdk-electronics.tdk.com...2ba503/ferrites-and-accessories-db-130501.pdf

Section 6.4 details how they derive values for Ptrans. Note that this approach makes many, many assumptions. For example, it assumes that core loss and copper loss are equal. This is, by itself, a fairly arbitrary assumption, and one that's not trivial to design for.

The text basically acknowledges that the practical use of Ptrans is quite limited:
The tabulated power capacities provide a means for making a selection among cores, although
the absolute values will not be met in practice for the reasons explained before.
Some manufacturers offer tools meant to aid engineers in designing or simulating transformers. In the past I tried to use one offered by Epcos/TDK, but I don't think I ever got it to produce useful results. Not sure if that was because it was buggy or I was not using it correctly.
 
Last edited:
This sort of makes it unreliable even as a sanity check for other measurements. Thermal behavior is at least as complicated to accurately model as magnetic behavior, so a guesstimated model of one shouldn't be used to check the other. Stick to more direct methods like Pc=I*V.
Sure, I'll test it under power. Apart from this test, what I did was to measure the power at the power input. Transformer not saturated and power consumption from the power supply 2.4W, calculated loop 1.9W. This also proves something, but I will confirm it by measuring the power on the primary winding of the transformer.

I found something to estimate the transformer power. From this formula we can derive the formula for P. What do you think about it?
 

Attachments

  • Bez tytułu.png
    Bez tytułu.png
    99.8 KB · Views: 21
Sure, I'll test it under power. Apart from this test, what I did was to measure the power at the power input. Transformer not saturated and power consumption from the power supply 2.4W, calculated loop 1.9W. This also proves something, but I will confirm it by measuring the power on the primary winding of the transformer.
Using the DC power measurement is valid so long as the efficiency of your bridge is high. Should be feasible at lower excitation frequencies. Though you will still want to correct for copper losses (you could also include the bridge resistance into the copper losses).
I found something to estimate the transformer power. From this formula we can derive the formula for P. What do you think about it?
Yes, area product is another figure of merit commonly referred to. It's been a long time since I used it in a design, but I recall going through the steps to derive it myself, and it took quite a bit of effort. IIRC it's complicated because it considers the windings in much more detail (as opposed to Ptrans which simply assumes via the PIDOOMA method that copper loss and core loss are equal).

Understand that these figures of merit are not useful for calculating the actual power dissipated by a transformer, only for estimating how much power throughput a transformer (or its bobbin) can handle and for comparing cores/bobbins against each other (under the various assumptions involved in their calculation).

For example, let's say you have a nicely working reference design for a push pull converter, and you want to make use of the design but also double the power throughput. Well, first look up the Ptrans for the reference design based on its switching frequency and core shape/material (see page 163 of the TDK data book). Then find other entries in that table with twice the Ptrans value. Some of them are for different core sizes, some are for different materials/frequencies, or all at once. Boom, you have a bunch of viable options, without ever having to use your slide rule.
 
Last edited:
Understand that these figures of merit are not useful for calculating the actual power dissipated by a transformer, only for estimating how much power throughput a transformer (or its bobbin) can handle and for comparing cores/bobbins against each other (under the various assumptions involved in their calculation).

Sure, I just wanted to be able to estimate the maximum core power. I asked about this previously. The topic of losses is another issue too.
I have various recycled cores that I know nothing about and I want to know something about them and calculate what powers I can transfer through the core in my power supply design.
So the formula I provided above will actually calculate the maximum core power, or is it a big error in the estimate?
 
Hi,
Sure, I just wanted to be able to estimate the maximum core power. I asked about this previously. The topic of losses is another issue too.
"core power" can only be found in your last post. Where exactly did you ask about it?
"loss" can be found in almost any of your posts ... and you asked about "loss" in the only question of post#1.

--> Thus I thought your focus is on "loss". Now you say it is(just) "another issue" ....

Klaus
 
Where exactly did you ask about it?

And here is my question a few posts above.
How to calculate the maximum power that a core can transfer? How to estimate it? For a core with a gap, it can be calculated from energy, but what about a core without a gap? For example, I have an ETD34/17/11 - 3F3 core, and how can I know if it is suitable for a 500W power supply?


---EDIT
Below I present the line of thought and questions in the photo on how to use the losses and calculate the core power. The TDK formula seems more true because it takes into account many parameters

1. If I understand correctly, according to the information from TDK for frequencies from 1kHz to 2Mhz, , eddy currents have practically no significance, so there are hysteresis losses and losses on mosfets and windings? What causes the losses that I compared to the power consumption from the power supply to be, say, 90% hysteresis?
(I haven't determined the current and voltage losses yet, I will do it soon)


2. In the screenshot below I also ask about the ln variable and, if I understand correctly, the length of the winding on the carcass?

3. I can read the thermal resistance from the application. I also have an idea to stick a resistor to the ferrite, dissipate 2W of power on it and determine the thermal resistance of the core. What do you think?

4. PF = f · Bmax
B max is the induction value B at saturation?

--EDIT
I measured the voltage drop on the winding and the current and set the AVG value using a mathematical function on the oscilloscope. The core was operating in saturation.
Below is the table for 10kHz and 20kHz.
As you can see, the losses measured on the oscilloscope are slightly higher - is this probably due to winding losses?
So, with this test, can we confirm that the calculations and losses of the magnetic hysteresis loop are correct?
 

Attachments

  • Bez tytułu.png
    Bez tytułu.png
    261 KB · Views: 25
  • 345345345.PNG
    345345345.PNG
    14.8 KB · Views: 16
Last edited:

LaTeX Commands Quick-Menu:

Similar threads

Part and Inventory Search

Welcome to EDABoard.com

Sponsor

Back
Top