Passband Modulation
Newbie level 4

ive encountered such problem working out the waveforms of 4-PSK and 16-QAM with matlab. plz help!
The signal constellations of 4-PSK and 16-QAM are shown in Fig.3.1a and Fig3.1b, respectively.
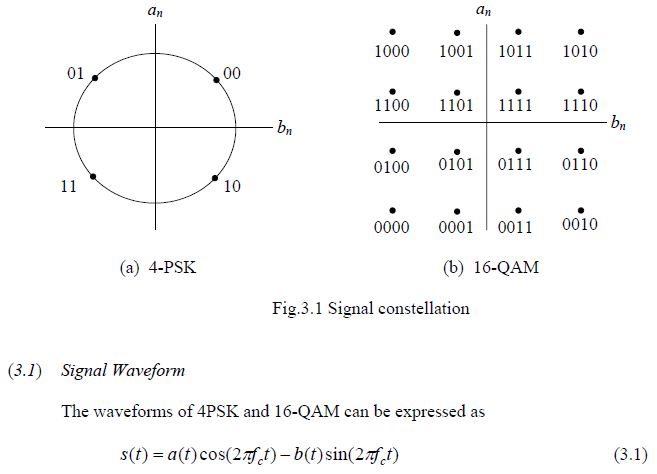
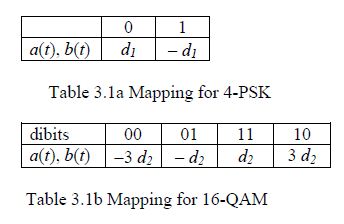
The amplitude values { a(t), b(t) } are obtained by mapping the information bits into signal values. The mappings for 4-PSK and 16-QAM are shown in Fig.3.1 with the information bits next to the constellation point. The mappings are summarized in Table 3.1
Plot the waveforms of 4-PSK and 16-QAM for the bit sequence {0101000001100111} (i.e. a1b1a2b2a3b3..…, the first two dibits of 16QAM is 00 and 11) with c f =1000 Hz and bit rate of 0.5kbit/sec. The waveform is sampled at the rate of 10kHz.
The signal constellations of 4-PSK and 16-QAM are shown in Fig.3.1a and Fig3.1b, respectively.
The amplitude values { a(t), b(t) } are obtained by mapping the information bits into signal values. The mappings for 4-PSK and 16-QAM are shown in Fig.3.1 with the information bits next to the constellation point. The mappings are summarized in Table 3.1
Plot the waveforms of 4-PSK and 16-QAM for the bit sequence {0101000001100111} (i.e. a1b1a2b2a3b3..…, the first two dibits of 16QAM is 00 and 11) with c f =1000 Hz and bit rate of 0.5kbit/sec. The waveform is sampled at the rate of 10kHz.

