mruzzi23
Newbie level 5

- Joined
- May 24, 2020
- Messages
- 10
- Helped
- 0
- Reputation
- 0
- Reaction score
- 2
- Trophy points
- 3
- Activity points
- 145
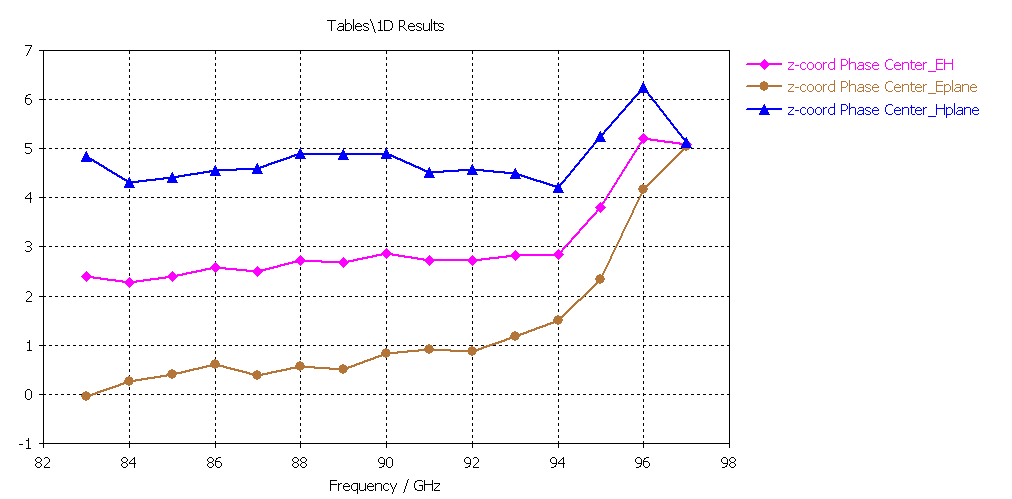
Hello, I'm writing a little report about an UWB antenna in the 3-6 GHz spectrum. The last point of the report says to calculate the Phase Center of the antenna and watch how it changes with the frequency. I tried to use the post-processing tools and I've been able to use "Export Phase Center" at the various frequencies, but I can't plot the variation with all the points, like this image

How can I do this?
Thank you

How can I do this?
Thank you
