yujun61hugh
Newbie level 2

how to calculate spectrum analysis in matlab
I need to get the precise spectrum component of the signal I generated in Matlab Simulink. The code i use now is shown as
Fs = 2e6; % Sampling frequency
T = 1/Fs; % Sample time
L = 2000000; % Length of signal
y = output(2001 L+2001),2)';
NFFT = 2^nextpow2(L); % Next power of 2 from length of y
Y = fft(y,NFFT)/L;
f = Fs/2*linspace(0,1,NFFT/2);
plot(f,2*abs(Y(1:NFFT/2)))
title('Single-Sided Amplitude Spectrum of y(t)')
xlabel('Frequency (Hz)')
ylabel('|Y(f)|')
Basicly, I simulate the system for 1.001 sec. and take the last 1s data to do FFT.
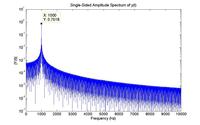
However, when I test this code using an ideal sin wave with frequency 1K Hz and amplitude equal to 1. the FFT result shows that at the 1K Hz, the signal component is only 0.75. who could tell me the reason and how to improve the code. Thanks a lot.
Added after 7 minutes:
I upload the spectrum figure here.

I need to get the precise spectrum component of the signal I generated in Matlab Simulink. The code i use now is shown as
Fs = 2e6; % Sampling frequency
T = 1/Fs; % Sample time
L = 2000000; % Length of signal
y = output(2001
NFFT = 2^nextpow2(L); % Next power of 2 from length of y
Y = fft(y,NFFT)/L;
f = Fs/2*linspace(0,1,NFFT/2);
plot(f,2*abs(Y(1:NFFT/2)))
title('Single-Sided Amplitude Spectrum of y(t)')
xlabel('Frequency (Hz)')
ylabel('|Y(f)|')
Basicly, I simulate the system for 1.001 sec. and take the last 1s data to do FFT.
However, when I test this code using an ideal sin wave with frequency 1K Hz and amplitude equal to 1. the FFT result shows that at the 1K Hz, the signal component is only 0.75. who could tell me the reason and how to improve the code. Thanks a lot.
Added after 7 minutes:
I upload the spectrum figure here.

