garvind25
Full Member level 3

Hi,
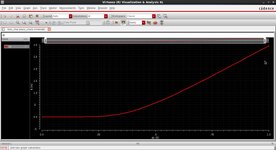
I am trying to plot gm/Id curve of a pmos in 90nm gpdk using Cadence. In it, when I use the ‘gmoverid’ signal directly available in the list, I am getting a max value of 41 (pls see attached snapshot). As I know, it cannot be more than 35 or 36 [as gm/Id = 1/ (n*Vt) = 1/(n*26mV) = 38.5/n and the value of n = 1.3 or 1.4 for bulk Si process].

So what am I doing wrong pls?
Thanks and Regards,
Arvind Gupta
I am trying to plot gm/Id curve of a pmos in 90nm gpdk using Cadence. In it, when I use the ‘gmoverid’ signal directly available in the list, I am getting a max value of 41 (pls see attached snapshot). As I know, it cannot be more than 35 or 36 [as gm/Id = 1/ (n*Vt) = 1/(n*26mV) = 38.5/n and the value of n = 1.3 or 1.4 for bulk Si process].
So what am I doing wrong pls?
Thanks and Regards,
Arvind Gupta


