peterruben
Newbie level 1

Hello guys,
i programmed a wavelet for denoising. I used symlet21 with a level of 5 and an adapted hart thresholding.
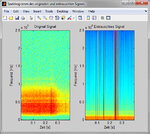
My result is in the picture.
What are the red lines in the spectrum of the signals after denoising? Are this mistakes in the calculation ? Because before denoising the signal they cannot be seen so cleary.
My other idea is that this red lines are the dominant frequencies. But why are the red lines over the entire frequency range (after denoising)?
Thank you for your help!
