ELECTRONICIENSENIOR
Member level 3

Hello,
I don't know if it is the good side for my post.
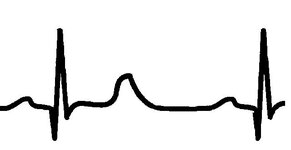
I have modified with paint a sample ECG curve and I want to obtain (not with paper and paincil) a list of y coordinates according to time to put in a table, in order to work to the draw and scroll, including X and Y scaling. How can I do it ?
Thank you for help

