Continue to Site

Welcome to EDAboard.com

Welcome to our site! EDAboard.com is an international Electronics Discussion Forum focused on EDA software, circuits, schematics, books, theory, papers, asic, pld, 8051, DSP, Network, RF, Analog Design, PCB, Service Manuals... and a whole lot more! To participate you need to register. Registration is free. Click here to register now.

C#/Visual Studio Express/Windows Form/Graphing Serial Port?

Status
Not open for further replies.

johnjameson

Junior Member level 3
Joined
Jan 30, 2012
Messages
31
Helped
0
Reputation
0
Reaction score
0
Trophy points
1,286
Activity points
1,516
Hey Guys,
I followed a tutorial and done a program in visual studio where its reading in values via the serial port and displaying them in a text box,just random numbers really.Code is only a couple of lines long.
I'm wondering can I graph those values as they're coming in?
I tried this example using the chart component as it only had a few lines of code but was unsuccessful.
https://codeabout.wordpress.com/2011/05/15/easy-way-to-plot-graphs-in-c-and-visual-studio-2010/

Would the above method work combined with passing the value to one of the axis(x axis) from the serial port?
Or if not could anyone direct to another tutorial that shows how to graph the serial port
 

it depends on a number of parameters in particular how fast the serial data is arriving and the speed of the host system.
1. As the serial data arrives the SerialPort event handler can put it into a buffer (ring buffer, double buffer, ??)
2. a BackgroundWorker can process the data a pass it to a Chart component

if the data is arriving too fast the display of the data will be unable to keep up and data will be lost.

If you host PC has multiple processors you could run two processes
1. receiving the data and put it into shared memory
2. extracting the data from shared memory and displaying it

it is often a question of trying it and seeing if it works for the application

For eaxmple, below is a graph of heater temperature readings from a Bytronic PIC24 mechatronics trainer using ON/OFF control over CANBUS
**broken link removed**

CANgraph.jpg

the data is received via USB (but could be serial) and plotted on a Form using Paint() method rather than Chart
 

Attachments

  • PIC24graph.jpg
    PIC24graph.jpg
    22.3 KB · Views: 212
Last edited:

Right now I'm just using a Com Port data Emulator to simulate the data coming from the serial port so its not coming through very fast at all.
 

you should have no problem if the data rate is low, e.g. 10's of samples/second
are you plotting in response to an event which will trigger the start of plotting or are you plotting a continuous signal (e.g. like an oscilloscope) ?
I have used the Chart component at some time in the past couple of years but having trouble finding the project. Plenty of plotting using the Form Paint() method though
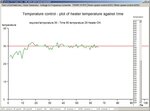
below is a plot of Temperature control using a Bytronic Control System Trainer (again data via USB)
**broken link removed**

temperatureControlb.jpg

note that outputing to a TextBox (as temperature values shown above screen shot) can slow the display of information (and hence graph plotting) significantly as the TextBox scrolls
 

you should have no problem if the data rate is low, e.g. 10's of samples/second
are you plotting in response to an event which will trigger the start of plotting or are you plotting a continuous signal (e.g. like an oscilloscope) ?
I have used the Chart component at some time in the past couple of years but having trouble finding the project. Plenty of plotting using the Form Paint() method though
below is a plot of Temperature control using a Bytronic Control System Trainer (again data via USB)
**broken link removed**

View attachment 108781

note that outputing to a TextBox (as temperature values shown above screen shot) can slow the display of information (and hence graph plotting) significantly as the TextBox scrolls
Data sample rate is low,its like 1 sample a second.
Also its a continuous signal
Not too worried if outputting the data to a textbox slows the display if I can something visually.
 

at one sample per second you should have no problems

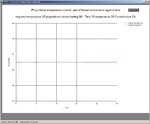
found an example using the Chart component using the Bytronic Mechatronics trainer using proportional control of heater temperature
ProportionalControlChart.jpg
 

Ok good.
Do you have a link to a chart component example?
if you do a web search for Visual C++ Chart example you will find plenty of links

in particular have a look at
https://www.youtube.com/watch?v=rx14eHnML1Q

using Visual Studio you can configue the chart in terms of axes, titles, etc by clicking on the chart in the Form[Design] and then configuring the properties, e.g. the Series collection for the Axes, Chart type (Line, Point, etc) etc
then at run time you add data to the graph using the AddXY() method
Code:
chart1->Series["current temperature"]->Points->AddXY(plottime[index], plotTemperature[index]);
 

Thanks Horace,I'll read through all that and watch the video and then have a go at writing it.
 

Watched a few vids on using the chart Component.
I can create the charts fine,edit what type of chart I want ,add data using the XY method
e.g
Code:
chart1.Series["Age"].Points.AddXY("Max",25);
but thats only when I'm adding in the the data myself in the code,I'm not sure myself on how to pass the data coming from the serial port to the graph instead,still a little lost on that.
 

depends on how the data from the serial port is encoded

assuming it is encoded as an integer value in a byte (range -128 to 127) it could be something along the lines of
Code:
// data received from serial port
private: System::Void serialPort1_DataReceived(System::Object^  sender, System::IO::Ports::SerialDataReceivedEventArgs^  e) {
		static int time=0;
		int data;
		while(serialPort1->BytesToRead)
			{
			int data=serialPort1->ReadByte();
			cout << "data " << data << endl;
			chart1.Series["Age"].Points.AddXY(time++, data);
			}
		 }
when you get the SerialPort DataReceived event you read the bytes adding them to the chart (also printing to the console which is useful for debugging)

what format is the serial data in? intger value (as above), text string, ??
 

Had the format as string,also I think I was putting the chart code in the wrong section.
The code itself is a bit messy.(that's minus the chart code atm though)
Code:
using System;
using System.Collections.Generic;
using System.ComponentModel;
using System.Data;
using System.Drawing;
using System.Linq;
using System.Text;
using System.Threading.Tasks;
using System.Windows.Forms;
using System.IO.Ports;
using System.IO;
//using System.Windows.Forms.DataVisualization.Charting;

namespace Serial_receive
{
    public partial class Form1 : Form
    {
        public Form1()
        {
            InitializeComponent();
        }

        private void button1_Click(object sender, EventArgs e)
        {
            string[] ports = SerialPort.GetPortNames();
                        foreach (string port in ports)
                        {
                            comboBox1.Items.Add(port);
                        }
        }
        //
        string t;
        private void button2_Click(object sender, EventArgs e)
        {
           

            t = comboBox1.Text.ToString();

            sErial(t);

        }
        //method
                SerialPort sp;
                void sErial(string Port_name)
                {
                    sp = new SerialPort(Port_name, 9600, Parity.None, 8, StopBits.One);
                    sp.DataReceived += new SerialDataReceivedEventHandler(DataReceivedHandler);
                    sp.Open();
                }
        //
                 void DataReceivedHandler(object sender,SerialDataReceivedEventArgs e)
                {
                    SerialPort sp = (SerialPort)sender;

                    string w = sp.ReadLine();
                    
                    string FolderName = Environment.GetFolderPath(Environment.SpecialFolder.Desktop);   //set destination as your desktop
                    using (StreamWriter SW = new StreamWriter(FolderName + "\\test.txt", true))   //true makes it append to the file instead of overwrite
                    {
                        SW.WriteLine(w);
                        SW.Close();
                    }
                    //string msg = sp.ReadExisting();
                    if (w != String.Empty)
                    {
                        Invoke(new Action(() => richTextBox1.AppendText(w)));
                    }

                }
          }
    }
 

what does the output produced by the following line look like?
Code:
Invoke(new Action(() => richTextBox1.AppendText(w)));
if it is an integer represented by a string (e.g. "123") you can parse it to an int then plot the int value
Code:
string w = sp.ReadLine();
Int32 number;
bool result = Int32::TryParse(w, number);
chart1.Series["Age"].Points.AddXY(time++, number);
 
Last edited:

Code:
string w = sp.ReadLine();
Int32 number;
bool result = Int32::TryParse(w, number);
chart1.Series["Age"].Points.AddXY(time++, number);
I had a go at putting in the above code but it came back with errors although I just changed a few bits in the code and it worked,as the numbers came it graphed them as they went along every second.
Code:
string w = sp.ReadLine();
int time=0;
Int32 number;
bool result = Int32.TryParse(w, out number);
chart1.Series["Age"].Points.AddXY(time++, number);

Then after success I had a go at saving the graph as an image.
First I added
Code:
using System.Windows.Forms.DataVisualization.Charting;
then after my chart code
Code:
this.chart1.SaveImage("C:\\Users\\johnjames\\Desktop\\mychart.png", ChartImageFormat.Png);

Unfortunately though this caused an error when the program is run,when it goes to read from the com port,an error comes up and a big X is placed across the graph although data is still displayed in the textbox.
I presume its some confliction when the program both trying to graph and save the data coming in at the same time.
I thinking maybe instead I could add a stop button to the windows form so when the button is pressed,data will stop coming in and the graph would then be saved to the desktop.
 

my code is C++ I guess you are using C# hence the difference

good to hear graph is working!

no idea about image - I have never tried saving a chart as an image - will give it a go

are you trying to save the image in the serialport event handler?
 

my code is C++ I guess you are using C# hence the difference

good to hear graph is working!

no idea about image - I have never tried saving a chart as an image - will give it a go

are you trying to save the image in the serialport event handler?
I have a button on the Form
ProportionalControlChart1.jpg
and when I click the button it saves the image - the event handler is
Code:
private: System::Void chartButton_Click(System::Object^  sender, System::EventArgs^  e) {
			 chart1->SaveImage("C:\\temp\\mychart.png", ChartImageFormat::Png);
		 }
 

I have a button on the Form
View attachment 108898
and when I click the button it saves the image - the event handler is
Code:
private: System::Void chartButton_Click(System::Object^  sender, System::EventArgs^  e) {
			 chart1->SaveImage("C:\\temp\\mychart.png", ChartImageFormat::Png);
		 }
Ya I did the same except its also closes the serial port as well
Code:
private void button3_Click(object sender, EventArgs e)
                 {
                     sp.Close();
                     this.chart1.SaveImage("C:\\temp\\mychart.png", ChartImageFormat.Png);
                 }

- - - Updated - - -

I hooked it up to a sensor on a breadboard,whilst its read the data and its graphing the data,its coming in way too fast so its kinda hard for the graph to keep up.
Here's the sensor code.

Code:
#include <REG51.H>                /* special function register declarations   */ 
#include <stdio.h>                /* prototype declarations for I/O functions */   
void serial_init(void); 
//------------------------------------------------- 
//Setup the serial port for 9600 baud at 11.0592MHz. 
//------------------------------------------------- 
void serial_init(void) 
{     
SCON  = 0x50;                         /* SCON: mode 1, 8-bit UART, enable rcvr         */     
TMOD |= 0x20;               /* TMOD: timer 1, mode 2, 8-bit reload                    */     
TH1   = 0xFD;               /* TH1:  reload value for 9600 baud @ 11.0592MHz*/    
TR1   = 1;                  /* TR1:  timer 1 run                               */     
TI    = 1;                  /* TI:   set TI to send first char of UART           */ 
}  

unsigned char sec,sec100;
unsigned int bt,tick,r,bpm;
void msdelay(unsigned int);

void extrint (void) interrupt 0 // external Interrupt to detect the heart pulse
{
bt=tick; // number of ticks are picked
tick=0; // reset for next counting
}
void timer0 (void) interrupt 1 using 1 // Timer 0 for one second time
{
TH0 = 0xdc; //The value is taken for Ssc/100 at crystal 11.0592MHz
sec100++; // It is incremented every Ssc/100 at crystal 11.0592MHz
tick++; // This variable counts the time period of incoming pulse in Sec/100
if(tick>=3500){tick=0;} // tick are limited to less trhan 255 for valid calculation
if(sec100 >=100) // 1 sec = sec100 * 100
{
sec++;
sec100=0;
}
}
void main()
{
serial_init(); 
P0=0xff;
P1=0xff;
P2=0xff;
P3=0xff;

EA = 1;
TMOD = 0x21;
IT0 = 1;
EX0 = 1;
ET0 = 1;
TR0 = 1;
msdelay(1000);

msdelay(1000);
printf("Heart beat ");
msdelay(1500);
msdelay(500);
//delay(15000);
bpm=0;bt=0;
while(1)
{
if(sec >=1)
{
sec=0;
/*
The sampling time is fixed 1 sec.
A variable "tick" is incremented with one tick per 100mSc in the timer 0 interrupt routine.
Each on occurring of external interrupt the value in the "tick" is picked up
and it is set to zero for recounting.
The process continues till next external interrupt.
Formula for calculating beats per minutes (microcontroller based heartbeat monitor ) is
as tick is the time period in Sec/100. so extract the frequency of pulses at external interrupt
Frequency = (1/tick)* 100 i.e pulses /sec
Then
bpm = frequency * 60 for one minutes i.e pulses per minute
in short we can do it as
bpm = 6000/ bt
*/

if(bt >=7){
bpm = 6000/bt; // for valid output bt is limited so that it should be greater than 6
msdelay(500);
//printf("Pulse. ");
r=bpm%100;
//printf("bpm: %d\r\n", bpm);
printf(" %d\r\n", bpm);	
}
else {
printf("out of range");} // otherwise bpm will be shown zero
}
}
}

void msdelay(unsigned int i)
{
//unsigned int i;
while(i --);
}

I'm thinking I should put in delay between read counts or something or maybe if it only read from it when a finger is placed on the sensor
 

if you don't have display all the data you can set options via TextBoxes or Trackbars to select portions of data or to skip parts of the data
fft1.jpg
the above is displaying data acquired using a dsPIC33FJ256GP710 from two ADCs using DMA to fill double buffers - when a buffer is full an FFT is performed on the data and the results sent to a PC via 10baseT for display.
The display shows the two signals and the frequency and phase results of the FFT - the signals voltage can be changed using trackbars and data can be skipped when displaying (one has to be careful doing this or you can get undersampling effects when looking at data).
Worth noting this was implemented using CodeBlocks, gcc and wxSmith not MS Visual Studio
 
Last edited:

Status
Not open for further replies.

Similar threads

Part and Inventory Search

Welcome to EDABoard.com

Sponsor

Back
Top