mrflibble
Advanced Member level 5

- Joined
- Apr 19, 2010
- Messages
- 2,720
- Helped
- 679
- Reputation
- 1,360
- Reaction score
- 652
- Trophy points
- 1,393
- Activity points
- 19,551
I recently ran into something that had me puzzled for a while.
I had a very regular design in the sense that essentially it was a small block copy-pasted along a line. As in, a long (192 bit) carry chain with a decode stage. The decode block was in chunks of 12 bits, so there were 16 of those decode blocks along the entire carry chain to handle all 192 bits.
I had all elements in place with RLOCs, LOCs and BELs, so it was about as regular as I could get it. Now most of that design met the timing constraints. However paths 2 did fail. The failing paths were parts of the decode blocks.
Since the carry chain spans multiple clocking regions, at first I thought it it might be related to these clocking regions. But after some more digging in fpga editor I noticed that for the failing paths it did the routing a bit different compared to the rest.
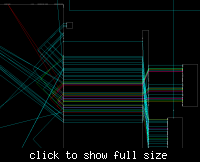
See fpga editor screenshot...

So these are 2 slices, both in the same CLB. The red line that bounces across is the failing path. As you can see the 4 routes from the lower slice all have a fanout of 3, one for each LUT in the upper slice that it routes to. So what you see in the screenshot is 12 colored paths total, of which only 1 is failing.
I still haven't found out why for this route it decides to bounce across (and not meet timings) while for all the others in identical blocks there is no problemo. Any idea what this can be? My guess at the moment was routing starvation (as in no more routes of a particular type), but then why do only 2 routes fail in 2 of these decode blocks while for all the other 14 blocks there is no problem?
And related to that, is there a way to get a report on routing resource usage in ISE? If I could get a report for each slice that summed up how much of the routing resources of each type was used I could find this sort of thing quicker, without spending an hour+ in fpga editor tracing down paths.
I had a very regular design in the sense that essentially it was a small block copy-pasted along a line. As in, a long (192 bit) carry chain with a decode stage. The decode block was in chunks of 12 bits, so there were 16 of those decode blocks along the entire carry chain to handle all 192 bits.
I had all elements in place with RLOCs, LOCs and BELs, so it was about as regular as I could get it. Now most of that design met the timing constraints. However paths 2 did fail. The failing paths were parts of the decode blocks.
Since the carry chain spans multiple clocking regions, at first I thought it it might be related to these clocking regions. But after some more digging in fpga editor I noticed that for the failing paths it did the routing a bit different compared to the rest.
See fpga editor screenshot...

So these are 2 slices, both in the same CLB. The red line that bounces across is the failing path. As you can see the 4 routes from the lower slice all have a fanout of 3, one for each LUT in the upper slice that it routes to. So what you see in the screenshot is 12 colored paths total, of which only 1 is failing.
I still haven't found out why for this route it decides to bounce across (and not meet timings) while for all the others in identical blocks there is no problemo. Any idea what this can be? My guess at the moment was routing starvation (as in no more routes of a particular type), but then why do only 2 routes fail in 2 of these decode blocks while for all the other 14 blocks there is no problem?
And related to that, is there a way to get a report on routing resource usage in ISE? If I could get a report for each slice that summed up how much of the routing resources of each type was used I could find this sort of thing quicker, without spending an hour+ in fpga editor tracing down paths.


