Continue to Site

Welcome to EDAboard.com

Welcome to our site! EDAboard.com is an international Electronics Discussion Forum focused on EDA software, circuits, schematics, books, theory, papers, asic, pld, 8051, DSP, Network, RF, Analog Design, PCB, Service Manuals... and a whole lot more! To participate you need to register. Registration is free. Click here to register now.

what is non-stationary signals

Status
Not open for further replies.

Aya2002

Advanced Member level 4
Joined
Dec 12, 2006
Messages
1,140
Helped
184
Reputation
376
Reaction score
117
Trophy points
1,343
Location
Iraq
Activity points
8,006
stationary signals

Hi Friends,

i need to know what is the non stationary signals?

if someone can help me by equations and drawing please....
 

what is nonstationery

hi Friend,
stationary signals are independent of time eg x[n]=5 DC signal

non-stationary signals are dependent on time x[n] = n ramp signal

Are u asking abt statonary procecess


Happy learning
 

    Aya2002

    Points: 2
    Helpful Answer Positive Rating
thank you rramya, as i tolled you. You are very expert.

this is very clear for me.

Added after 3 hours 26 minutes:

Hi rramya,

I am so sorry as i think your answer is not correct. I found out in the following link the answer as followes:

**broken link removed**

Let's take a closer look at this stationarity concept more closely, since it is of paramount importance in signal analysis. Signals whose frequency content do not change in time are called stationary signals . In other words, the frequency content of stationary signals do not change in time. In this case, one does not need to know at what times frequency components exist , since all frequency components exist at all times !!! .

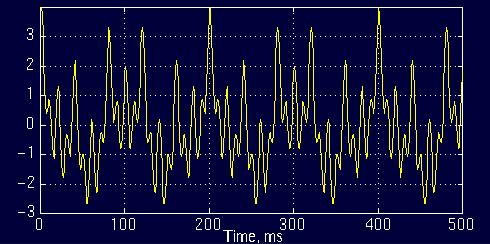
For example the following signal

x(t)=cos(2*pi*10*t)+cos(2*pi*25*t)+cos(2*pi*50*t)+cos(2*pi*100*t)

is a stationary signal, because it has frequencies of 10, 25, 50, and 100 Hz at any given time instant. This signal is plotted below:

70_1238168476.jpg

Figure 1.5

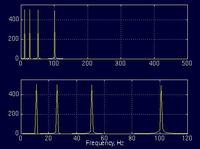
And the following is its FT:


Figure 1.6

The top plot in Figure 1.6 is the (half of the symmetric) frequency spectrum of the signal in Figure 1.5. The bottom plot is the zoomed version of the top plot, showing only the range of frequencies that are of interest to us. Note the four spectral components corresponding to the frequencies 10, 25, 50 and 100 Hz.

Contrary to the signal in Figure 1.5, the following signal is not stationary. Figure 1.7 plots a signal whose frequency constantly changes in time. This signal is known as the "chirp" signal. This is a non-stationary signal.


Figure 1.7

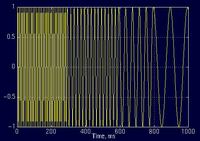
Let's look at another example. Figure 1.8 plots a signal with four different frequency components at four different time intervals, hence a non-stationary signal. The interval 0 to 300 ms has a 100 Hz sinusoid, the interval 300 to 600 ms has a 50 Hz sinusoid, the interval 600 to 800 ms has a 25 Hz sinusoid, and finally the interval 800 to 1000 ms has a 10 Hz sinusoid.


Figure 1.8

If it is incorrect, please rectify me.

thanks
 

Status
Not open for further replies.

Part and Inventory Search

Welcome to EDABoard.com

Sponsor

Back
Top