Continue to Site

Welcome to EDAboard.com

Welcome to our site! EDAboard.com is an international Electronics Discussion Forum focused on EDA software, circuits, schematics, books, theory, papers, asic, pld, 8051, DSP, Network, RF, Analog Design, PCB, Service Manuals... and a whole lot more! To participate you need to register. Registration is free. Click here to register now.

How to get frequency response of a filter in Matlab?

Status
Not open for further replies.

smartshashi

Member level 4
Member level 4
Joined
Aug 11, 2004
Messages
68
Helped
0
Reputation
0
Reaction score
0
Trophy points
1,286
Activity points
513
frequency response matlab

I designed a Butterworth IIR filter in matlab. I want to see frequency response of filter (not FFT) i.e Amplitude Vs Frequency. How to get this? If anybody have matlab code for this please do send me.

Thanks.
 

normalized frequency matlab

use function bode(num,den) of the matlab
give numerator (num) & denominator (den) in matrix form.
i.e. for s^2+1 num=[1 0 1]
 
plot frequency response matlab

Given a transfer function, the MATLAB function freqz() can be used to
determine the frequency response. The syntax is given by

[h,w]=freqz(A,B,N)

whose parameters are defined as:
h = an output vector containing frequency response
w =an output vector containing normalized frequency values distributed
in the range from 0 to p radians.
B = an input vector for numerator coefficients
A= an input vector for denominator coefficients
N = the number of normalized frequency points used for calculating the
frequency response

wxample:
--------------
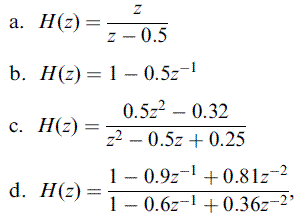
Given each of the following digital transfer functions,

8_1235600894.gif


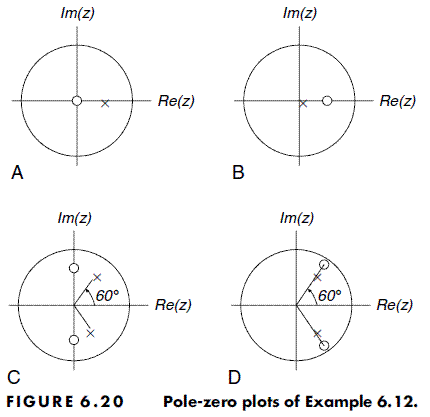
1. Plot the poles and zeros on the z-plane.
2. Use MATLAB function freqz() to plot the magnitude frequency response
and phase response for each transfer function.
3. Identify the corresponding filter type, such as lowpass, highpass, bandpass,
or bandstop.

Solution:
----------
1. The pole-zero plot for each transfer function is demonstrated in Figure
6.20. The transfer functions of (a) and (c) need to be converted into the
standard form (delay form) required by the MATLAB function freqz(), in
which both numerator and denominator polynomials have negative
powers of z. Hence, we obtain

22_1235601027.gif


while the transfer functions of (b) and (d) are already in their standard
forms (delay forms).

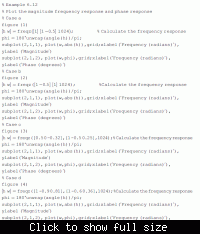
2. The MATLAB program for plotting the magnitude frequency response
and the phase response for each case is listed


and here figure 6.20:

34_1235601549.gif


enjoy
 
Status
Not open for further replies.

Similar threads

Part and Inventory Search

Welcome to EDABoard.com

Sponsor

Back
Top