Welcome to our site! EDAboard.com is an international Electronics Discussion Forum focused on EDA software, circuits, schematics, books, theory, papers, asic, pld, 8051, DSP, Network, RF, Analog Design, PCB, Service Manuals... and a whole lot more! To participate you need to register. Registration is free. Click here to register now.
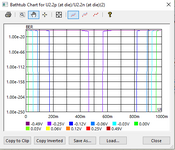
I am wondering how do we analyze BER using Bathtub. I have attached a chart and I need to analyze it. Any explanation please to understand the BER plots on the Bathtub.
this looks more like the Grand Canyon than a bathtub 1e-250 ?
It appears to be a low noise with an infinite slope on BER for the comparator or logic device that shows the symmetry or threshold error vs Vi in terms of a transition from either logic level.
Very strange.
U2.2p is actually pin number 2 positive end of the differential signal at the device U2. I am running some gigabit transceiver cannel simulations and I got the BER plotted in Bathtub which I am not able to get.
I am familiar with analyzing BER curves, Window Margin statistics, Phase Margin Plots and Eye pattern margins, but I have no idea what equipment you have and what you want to measure.
Please explain in detail your issues, what you can /cannot do.
. Your plots show extremely high SNR with threshold-related margins.
This site uses cookies to help personalise content, tailor your experience and to keep you logged in if you register.
By continuing to use this site, you are consenting to our use of cookies.
") 1e-250 ?
1e-250 ?