Continue to Site

Welcome to EDAboard.com

Welcome to our site! EDAboard.com is an international Electronics Discussion Forum focused on EDA software, circuits, schematics, books, theory, papers, asic, pld, 8051, DSP, Network, RF, Analog Design, PCB, Service Manuals... and a whole lot more! To participate you need to register. Registration is free. Click here to register now.

Saving the image of many output signals in Cadence Virtuoso

Status
Not open for further replies.

Junus2012

Advanced Member level 5
Joined
Jan 9, 2012
Messages
1,552
Helped
47
Reputation
98
Reaction score
53
Trophy points
1,328
Location
Italy
Activity points
15,235
Hello,

I have a problem when I try to save the image of my circuit that have many outputs,

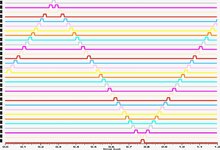
the problem is that the saved image capture only the visible signals from the simulation result viva window, as an example I have about 20 signals but when I save the image I can only see like 8 signals.

Hence I am saving a batch of signals every time and merging them using third party software,

I believe there is a way by Cadence where it could be done more perfectly in one shot and save the image quality and effort, and for this, I need your help


Thank you in advance

Best Regards
 

Maybe you can save a few window setups which divide
up the traces so they're legible. Does your waveform
viewer allow saving waveform-sets and scales etc.?

Otherwise, maybe export waveform data to some other
format (Excel .csv?) that another charting tool can deal
with, that offers more control of display qualities?
 
Why don't you just capture the screen with snipping tool or something similar? Quality is good enough.
Thank you Suta, this work fine for internal presentations, but not enough for thesis quality
--- Updated ---

Maybe you can save a few window setups which divide
up the traces so they're legible. Does your waveform
viewer allow saving waveform-sets and scales etc.?
Yes sure I can divide the traces and save them separately but then I have to merge them in one image like using paint for example, and I would like to avoide this process because it reduces the quality of the picture
Otherwise, maybe export waveform data to some other
format (Excel .csv?) that another charting tool can deal
with, that offers more control of display qualities?
--- Updated ---

Any more info? Generally, it works perfect even with 1000 lines on the plot.
Thanks Dominik, it would be nice of you if you tell me how then my problem will be completely solved. Just to remind you, it is not about getting the result of 1000 trace, that it is for sure has no problem,
my problem how to save them in one time save command, as I have told before this option is not feasible to me, Cadence save only few traces and then I have to repeat this process
 
Last edited:

It works fine - 17 corners and 37 signals:
example_plot_multi_signals.png


saved by following command (equivalent to GUI):
saveGraphImage(?fileName fileName ?exactCopy nil ?width 636 ?height 1000 ?units "pixels" ?enableTitle nil ?saveAllSubwindows nil)
 
It works fine - 17 corners and 37 signals:
View attachment 172913

saved by following command (equivalent to GUI):
saveGraphImage(?fileName fileName ?exactCopy nil ?width 636 ?height 1000 ?units "pixels" ?enableTitle nil ?saveAllSubwindows nil)

Dear Dominik

Thank you very much for your perfect solution, this is what I am looking for exactly.

Please forgive my weak knowledge, I never used to write skill code for my cadence simulation.

Where I wrote the:
saveGraphImage(?fileName fileName ?exactCopy nil ?width 636 ?height 1000 ?units "pixels" ?enableTitle nil ?saveAllSubwindows nil)

and also the parameters like fileName

At the end where he will save the image

Thank you very much once again and I do appreciate your help
Regads
 

saveGraphImage is a function equivalent to ViVA→Save image GUI. Put it name into Help Search in CIW for more details.
To use it, you can simply write it to CIW, where filename is name of the output file in quotes.

However, by using GUI like follow:
example_plot_multi_signals-gui_setup.PNG

you can get the same results:
example_plot_multi_signals-gui.png


So, I am unsure about your issue.
 
The issue is that Cadence documentation in paper
form is about 2 feet thick (IC5 binders on my bookshelf,
last printed when I was still using someone else's ink)
and the "Help" search will only get you to the simplest
explanation, if any - examples are few and specific
examples of what you really wanted are generally
none.

But this is a good one and I'll be saving it.
 
Hello,,
saveGraphImage is a function equivalent to ViVA→Save image GUI. Put it name into Help Search in CIW for more details.
To use it, you can simply write it to CIW, where filename is name of the output file in quotes.

However, by using GUI like follow:
I used your setting but not working with me so I did the merge externally, which I tried my best to avoid
here is my signal.... it has 31 traces


Thank you once again
 

Attachments

  • test2.jpg
    test2.jpg
    72 KB · Views: 124

OK. Now I see what is your point.
The problem is, saveGraphImage function is saving visible traces only. So, by making strip for every trace, some of them are going out of the box and scroll line is added.

To overcame it you have to:
1. change minimum height of analog strip to 1: RMB on graph → Graph Properties→Strips
1637676960685.png

2. Save image with enough height.
Example of 2kpx height:
strp_test1.png
 
Status
Not open for further replies.

Part and Inventory Search

Welcome to EDABoard.com

Sponsor

Back
Top